Key Economic Findings from UChicago Research
Summary analysis of the latest research from UChicago scholars, complementing the BFI Working Paper series that draws from more than 200 economists on campus.
Filter By
-
Children from low-income families have lower math test scores, on average, than their higher-income peers. These disparities are of concern in their own right and because early childhood math test scores tend to predict later outcomes. Evidence suggests that income-based achievement gaps are in part driven by unequal engagement from parents, with higher-income parents spending more time on math activities than lower-income parents. This study aims to uncover what drives these persistent gaps in achievement and parental engagement and, in turn, what policies and programs will effectively improve learning outcomes among low-income students.

The authors conducted a randomized controlled trial with 758 low-income preschoolers and their parents, who they separated into a control group and four treatment groups. The first treatment group received a set of math materials, the second received the same materials along with weekly text messages intended to overcome any tendency among parents to procrastinate doing math with their kids (referred to as “present bias”), and the third received the materials and weekly text messages promoting a growth mindset. Finally, the fourth treatment group received a digital tablet with math apps for children. The authors tested children’s math skills three times — before the intervention, upon the conclusion of the intervention, and six months afterwards — and surveyed parents regarding the amount of time that they spent doing math with their kids. They found the following:
- Relative to the control group, both the math app treatment and the material plus procrastination treatment increased children’s math skills six months after the intervention ended, while the other treatments did not increase children’s math skills.
- The two treatments that improved math skills also increased the amount of time that parents reported having spent engaging in math activities with their children, while the two treatments that did not increase math skills also did not increase the amount of time that parents reported having spent on math. This suggests that increased parent engagement is a mechanism that leads to improved math skills.
- A considerable share of parents (17%) in the materials-only group reported losing the materials, and only 37% finished half of the activities included in the materials. This limited use suggests that the provision of materials alone is insufficient to help low-income families overcome learning gaps.
- The survey data show that most parents already exhibit growth mindsets, thereby reducing the benefits of interventions that aim to cultivate growth mindsets in parents.
The upshot is that simply telling parents that they should engage in learning with their children, even if the materials for engagement are also provided, is unlikely to change their behavior. This is especially the case when parents are constrained by psychological stress or financial scarcity. The results also indicate that a potential barrier preventing parents from using math materials when they are available is present bias, or the tendency to procrastinate when a reward is delayed. Finally, the surprising effectiveness of the math app treatment on both parent engagement and test scores suggests a new, lost-cost avenue for improving children’s math skills at home.1
1 See also “Nudging or Nagging? Conflicting Effects of Behavioral Tools,” by Ariel Kalil, et al., for a Finding and links to the paper.
-
Labor market policies, which include programs such as vocational training, job search aid, and wage subsidies, are of increasing importance for ensuring a productive workforce amid ongoing structural changes in the labor market. Despite this, there is limited evidence regarding their effectiveness. Workers who opt into training programs likely differ systematically from those who do not, casting doubt on the results of studies that simply compare the outcomes of workers who do and do not complete training. This study overcomes this limitation by using data on jobseekers who are quasi-randomly matched with caseworkers to assess the impacts of a particular labor market policy in Denmark — classroom training.

The authors use administrative data from Denmark covering jobseekers who lost their jobs between 2012 and 2018. Importantly, for unemployed jobseekers to receive UI benefits from the Danish government, they must meet with a caseworker at a job center to receive assistance with their job search and assignment to a training program. Jobseekers are assigned caseworkers essentially randomly (based on their day of birth), and caseworkers differ in their tendencies to assign jobseekers to different types of training programs, with some caseworkers more likely to assign jobseekers to classroom training programs and others more likely to assign jobseekers to programs that provide training on the job. The authors exploit this in their research design and compare the employment outcomes of jobseekers from the same job center and year who, due to their day of birth, receive different counseling. They find the following:
- Jobseekers who are assigned to classroom training tend to work more as a result. These employment gains grow steadily over time, stabilizing at about 25 hours more per month two years after their initial job loss, equivalent to a 25% increase relative to before their job loss.
- By contrast, on-the-job-training programs, such as employment programs with wage subsidies, do not lead to employment gains.
- These results diverge from earlier studies that rely on observable characteristics of jobseekers and often conclude that classroom training has deleterious effects on employment. By contrast, this work accounts for selection based on unobserved characteristics when evaluating labor market policies; for example, jobseekers who face worse employment prospects are more likely to opt into training.
In the next part of the paper, the authors aim to uncover the mechanisms driving the effects revealed in their analysis. They find the following:
- The benefits of workforce training are driven primarily by the positive effects accrued by participants who complete the programs, rather than by jobseekers who simply exit unemployment upon commencing training. This suggests that classroom training increases employment by providing job seekers with skills that are valued in the labor market.
- Assignment to classroom training especially increases employment outside jobseekers’ original occupations, providing further support for the conclusion that workforce training helps workers find jobs through the provision of new skills.
- The employment effects of classroom training are driven by participants’ more successful job applications rather than by their intensified job searches, again underscoring the role of skill acquisition.
The authors conclude by exploring how these effects vary across different types of workers in order to offer insights relevant for policy:
- Jobseekers who are employed in occupations that are more exposed to offshoring have higher employment gains from classroom training. By quarter seven after their initial job loss, high-risk jobseekers gain 55 hours of employment per month from assignment to classroom training. This gain corresponds to 50% of their pre-job-loss level of employment.
- In contrast, jobseekers at low risk of offshoring derive much lower employment gains from assignment to classroom training. By quarter seven after their initial job loss, the gains for low-risk job seekers are not statistically significantly different from zero.
- Taken together, these results suggest that a cost-effective way to close the employment gap is to redistribute classroom training from low-risk to high-risk jobseekers. Note that this counterfactual scenario corresponds to assigning 25% of all job seekers to classroom training, compared to today’s 39%. Hence, this policy would lower total spending on classroom training programs while bolstering their effect on employment.
This paper provides novel evidence for the effectiveness of classroom training for helping displaced workers regain employment. From a methodological standpoint, this study illustrates the potential pitfalls in assigning causality in studies lacking at least quasi-randomness. For policymakers, this research offers a tool for closing the employment gap among job seekers affected by offshoring.
-
One persistent question in economics over the last 150 years is whether rising production concentration is somehow inevitable in modern industrial development. Since the 19th century and including Marx, continuing through Alfred Marshall near the dawn of the 20th, and onward to the present, many have wondered whether increasing concentration is mere coincidence or, perhaps, an economic law. Lenin certainly believed that concentration was inexorable, confidently stating in 1916: “[T]he enormous growth of industry and the remarkably rapid concentration of production … are one of the most characteristic features of capitalism.”

What happened in the century following Lenin’s assertion? This research examines this question by studying the evolution of production concentration in the US economy from 1918 to 2018. The authors develop a rich database by digitizing data on US corporations from the historical publications of the Statistics of Income (SOI) and the associated Corporation Source Book from the Internal Revenue Service (IRS). Since 1918, the SOI has been reporting annual statistics of the population of corporations by size bins, including the number of businesses and their financial information (e.g., assets, sales, net income,). Please see the working paper for more details on methodology. The authors use these size bins to estimate top businesses’ shares in the aggregate, in main sectors, and in subsectors, to find the following:
- Since the early 1930s, the asset shares of the top 1% and top 0.1% corporations have increased by 27 percentage points (from 70% to 97%) and 40 percentage points (from 47% to 88%), respectively.
- At the industry level, the authors note a general rise in corporate concentration among the main sectors and the subsectors, but the timing differs across industries. For manufacturing and mining, rising concentration was stronger in earlier decades (before the 1970s); for services, retail, and wholesale, rising concentration was stronger in later decades (after the 1970s).
- These results hold when the authors examine the relative concentration within the largest businesses (e.g., the top 1% relative to the top 10%), when they include noncorporations (partnerships and sole proprietorships) in years with available data, as well as when they review a fixed number of businesses (e.g., top 500 or 5,000).
The authors acknowledge that it is challenging to determine the precise cause of this persistent increase in corporate concentration, but they offer insights into the leading hypotheses, including the following:
Economies of scale
In line with previous research that has shown how industrial technologies have spurred concentration trends among US corporations1, they find that:
- The timing and the degree of rising concentration in an industry align closely with rising technological intensity, for example, the top 1% share in an industry comoves strongly with the investment intensity of R&D and IT. Also, patent data reveal that influential technologies are associated with more production concentration (whereas the total number of patents, per se, does not play a role).
- The degree of concentration is positively correlated with a measure of the intensity of fixed operating costs. In other words, to the degree that higher fixed costs favor production at scale, large firms have an advantage.
- Over the medium term, industries that experience higher increases in concentration also experience higher growth in real gross output, and their output shares in the economy expand.
Trade and globalization
International trade is not sufficient to explain industrial concentration trends over the last 100 years:
- For the United States, trade did not expand in the first half of the 20th century when manufacturing concentration was on the rise.
- Also, globalization only accelerated around the 1970s, when the rise in services concentration took hold; however, the volume of international trade in services is relatively small.
Regulation
On the question of whether, and to what degree, regulation has influenced corporate concentration, the authors find that:
- The data do not reveal a significant relationship between corporate concentration and standard aggregate antitrust enforcement measures, such as the number of antitrust cases filed by the Department of Justice (DOJ) or the budget of the DOJ’s antitrust division.
- That said, antitrust regulation could
have a more pronounced impact on a particular market. - In sum, the authors do not find that regulations have shifted in favor of large firms over the past century; moreover, they find no evidence that regulations particularly favored manufacturing over services in earlier decades, and then switched focus post-1970.
Bottom line: Long-run trends of US corporate concentration are likely explained by economies of scale. As to whether such concentration is “good” or “bad,” the welfare implications can be nuanced. For example, even if large firms emerge from economies of scale over time (that is, from seemingly “good” or at least “neutral” causes), their size may ultimately allow firms to wield power that unduly benefits them at the cost of, say, social wellbeing (an arguably “bad” outcome).
On the intriguing question of whether corporate concentration will persist into the future, the authors suggest that—historical evidence notwithstanding—the answer is not obvious.
At the turn of the 20th century, the inevitability of technological changes leading to increasingly larger enterprises and higher production concentration was a central doctrine of communism, with Lenin asserting that economies of scale due to “modern technology” would be so strong that the Soviet Union could be run by one giant firm to enhance efficiency. Though extreme, this view inspired the work of Ronald Coase on the boundaries of the firm, and influenced the direction of a number of prominent intellectual traditions. Some maintain that large enterprises will become all powerful and change the way society is organized, whereas others caution that large organizations face certain limitations. Which direction will we go? More analyses about the nature of the firm and the foundations for the organization of production may provide knowledge that can guide our outlook.
For more on the history of thought about the organization of production and the organization of society, please see Yueran Ma’s video presentation “Communism and the Chicago School.”
1 See “The Industrial Revolution in Services,” forthcoming from Journal of Political Economy, by UChicago economists Chang-Tai Hsieh and Esteban Rossi-Hansberg, for additional insights into methodology and findings related to US industrial concentration over the last 50 years; available as a BFI Working Paper, Research Brief, and Economic Finding.
-
Capital markets for large multinational firms can be characterized as external (when capital is supplied by a bank or bond markets, for example) or internal (wherein a firm issues capital to business units in the form of, say, redistributed profits). Of the two, we know less about the inner workings of internal capital, despite their prominence in global capital movements. In recent years, for example, internal capital flows between multinational parent firms and their international affiliates accounted for over 50 percent of total capital inflows in the median country. Internal capital flows are also large relative to aggregate output, amounting to 3.6 percent of GDP in the median country.
We also understand little about how internal capital markets impact the real economy. Do internal capital markets transmit shocks across countries? Which mechanisms and frictions play a role, like managerial biases, access to external credit markets, different currencies, and geographic distance? Do internal capital markets transmit financial and non-financial shocks differently? How large and persistent are the real effects of internal capital market shocks?

To address these questions, the authors study a lending cut by Commerzbank, Germany’s second-largest bank in 2008, whose corporate lending was concentrated in Germany. During the 2008-09 Financial Crisis, Commerzbank experienced significant losses on its financial investments that, while independent of Commerzbank’s corporate lending division, ultimately impacted corporate borrowers because the losses forced Commerzbank to reduce its loan supply. This exogenous shock to the credit supply impacted those multinationals located in Germany with a higher pre-crisis dependence on Commerzbank, but did not directly affect the credit supply of international affiliates of these multinationals.
The authors examine whether and how this lending cut affected international affiliates of impacted German parent companies. In doing so, the authors compare affiliates located in the same country at the same time, so that differences in demand or other country-specific shocks do not affect the estimates. The authors investigate a number of ways that a credit shock to parents could transmit through internal capital markets and affect international affiliates, to find the following:
- Sales of affiliates with greater parent Commerzbank dependence dropped sharply once Commerzbank reduced lending in 2008 and took until 2011 to fully recover.
- Affiliates with greater parent Commerzbank dependence would have evolved in parallel to other affiliates had Commerzbank’s lending cut in Germany not happened.
- Affiliates with previous internal loans strongly increased lending to their parent after the lending cut, but other affiliates did not. Also, the reduction in affiliate sales was large and significant for affiliates that had previous internal loans and increased internal lending, but insignificant for other affiliates.
- Affiliates with greater internal lending suffered large and significant sales declines, while the effects on other affiliates were relatively small and insignificant.
- Frictions due to currency, geography, and capital controls were not important, but developed external credit markets helped affiliates to partially attenuate these effects.
- Location matters: Weak international affiliates were hit more strongly, which leads the authors to characterize managers of multinationals as relatively “Darwinist” with respect to international affiliates. In contrast, affiliates within Germany were not significantly harmed, even if they were weak, implying that managers have “Socialist” preferences toward home country affiliates.
- Regarding non-financial shocks, the authors examine how internal capital markets adjusted when parents were hit by a large-scale flood in 2013. They show that flooded parents were not financially constrained, suggesting that internal capital markets transmit financial shocks (like Commerzbank’s lending cut) more strongly than non-financial shocks.
- Finally, the authors analyze the transmission of Commerzbank’s lending cut through German multinationals in various countries, to reveal how a shock to an individual firm in one country can have first-order effects on the distribution of firm growth in many other countries, solely because of transmission through the internal networks of multinationals.
Bottom line: This work offers new and key insights into the role internal credit markets, including that shocks can transmit across affiliates, that internal capital flows across countries depend on different frictions than flows within domestic business groups, that financial shocks are transmitted strongly within internal capital markets while non-financial shocks have a weaker impact, and that internal capital flows can also cause financial constraints and thereby harm growth.
-
Mentorship is a common tool for increasing entrepreneurs’ likelihood of success as well as for closing gender gaps, particularly in developing countries where the share of owner-entrepreneurs is greater and gender gaps are more pronounced. This paper studies the role of gender matching in entrepreneurship, asking whether mentorship is more effective at improving female entrepreneurs’ odds of success when mentors are female as well.


Examples of Virtual Entrepreneur – Mentor Meetings
The authors conducted a randomized controlled trial in which they divided 930 Ugandan entrepreneurs into a treatment group and a control group. Next, members of the treatment group were also randomly assigned a mentor from whom they received up to six months of virtual business support. Two years later, the authors collected data on sales and profits at the entrepreneurs’ businesses, revealing the following:
- Female entrepreneurs benefited more from female mentorship than they did from male mentorship. Female entrepreneurs mentored by females saw their firm sales increase by 34% and profits by 29%, on average, compared to the control group. By contrast, female entrepreneurs guided by male mentors did not significantly improve their performance.
- Mentor gender did not matter for male entrepreneurs – there was no significant difference in the outcomes of those matched with a male mentor versus a female mentor.
What drives these effects? The authors conducted follow up analysis using written meeting summaries, data on customer relations, and information about entrepreneurs’ levels of aspiration. They found the following:
- Female mentors used significantly more relational language when describing their interactions with female entrepreneurs, suggesting that female mentors may have formed closer bonds with female entrepreneurs.
- Female entrepreneurs who were matched with female mentors seemed to significantly improve their relationships with customers, based on measures including closeness of engagement, follow-up communication incidence and transaction volume. These improvements in customer relations appear to largely explain the strong positive effects of female mentorship on women.
- Female entrepreneurs who reported higher aspiration levels before receiving mentorship tended to benefit significantly more from female mentors, suggesting that aspirational female entrepreneurs may be better targets for training programs aimed at driving economic growth when such programs are delivered by females.
This paper makes the case for same-gender mentorship as a tool for helping to overcome the pervasive barriers to business success faced by female entrepreneurs in developing economies. More broadly, the approach holds promise across the many contexts in which women’s advancement is stymied by “glass ceilings,” though future research is needed to determine where it will be most effective.
-
Technological progress is key to economic growth; likewise, economists have long focused on how many resources a society dedicates to research and development (R&D), whether in aggregate R&D spending or in the share of inventors in the workforce. However, this new research argues that focusing on the quantities of R&D investment misses an important point: It is not only the level of innovation inputs that matters for growth, but also the allocation of those investments.
The authors’ investigation has its grounding in a 1962 insight from the economist Kenneth Arrow, who intuited that monopolists have incentives to defend their market positions rather than produce radical technological breakthroughs. If true, this means that while the number of inventors and total R&D spending in an economy is important, the efficacy of that spending is mediated by where those inventors are employed.

Figure 1 illustrates the authors’ provocative hypothesis. Panel A shows total factor productivity (TFP)2 in the United States since 2000 (left axis) and a per capita measure of inventor labor (right axis). While there is a visible acceleration between 2000-2005, after 2005 there is a marked slow-down in TFP growth, even as the share of inventors grew by over 70%. In other words, innovation inputs are rising as technical progress slows. Equally striking is the shifting allocation of inventors across different-sized firms. Not only did the US economy allocate a bigger share of its employment into innovation, but its composition has also shifted toward the largest players in the economy.
Panel B shows that the share of inventors employed by large, incumbent firms rose from 48 percent in 2000 to about 57 percent in 2016 (in a 2022 paper, the authors show a complementary fall in the share of inventors employed by young firms3). Finally, Panel C shows that inventors at incumbents produce lower quality innovations, with fewer citations, fewer citations per application, fewer independent claims, and more self-citations (a proxy for the incremental nature of an innovation).
These figures raise an important question that motivates this research: How are inventors allocated in the US economy, and does that allocation affect innovative capacity? To answer this question, the authors build a model that develops intuitions about the strategic incentives that incumbent firms face, and how they might use the innovation input market to limit competition. The model allows for an incumbent to hire an inventor who otherwise would create an innovation inside an entrant firm and displace the incumbent. Further, since the incumbent monopolist already has a successful product, it has less incentive to innovate.

So why would an established firm with successful products spend limited resources on hiring expensive inventors? The short answer: to stifle innovation. The authors’ model implies that inventors hired by incumbent firms will, indeed, earn more by working for an incumbent, but they will also produce fewer innovations. In other words, creative destruction, the process by which new innovations replace old ones, is diminished, slowing the growth of long-run output.
The authors then take their model to the data, examining the employment history of over 760,000 US inventors, finding the following:
- Inventors are increasingly concentrated in large incumbents, less likely to work for young firms, and less likely to become entrepreneurs.
- Inventors working for incumbent firms earn more and produce less impactful innovations than inventors at young firms.
- Finally, when an inventor is hired by an incumbent, compared to a young firm, their earnings increase by 12.6 percent and their innovative output declines by 6 to 11 percent; also, these patterns are robust to alternative explanations, and are not driven by promotion to managerial positions in large incumbents, for instance. (See Figure 2.)
Bottom Line: Innovation matters, and talent is key to invention; however, this research also reveals the importance of where innovation occurs. For policymakers, the lessons are salient. First, aggregate inputs (e.g., R&D spending or inventors per capita) may give a misleading picture of innovation capacity; second, factor reallocation toward large incumbents may lower growth capacity; and third, policies that encourage more incumbent innovation might occur at the expense of entrant innovations, which are higher quality on average.
This research also points to a number of interesting, policy-relevant questions. First, what role do non-compete agreements play in explaining when inventors work for incumbents or young firms? Policies that encourage or discourage spin-offs and inventor entrepreneurship may have significant impacts on innovation and growth. Second, what role do financial frictions play in the inventor’s choice to work for incumbent firms? The availability (or lack thereof) of capital may weaken incentives for inventors to start a new firm. These and other questions will benefit from further research, and the authors’ current and recent work—with its insights into the “black box” of inventor employment—offers a valuable starting point.
1 Any opinions and conclusions expressed herein are those of the authors and do not represent the views of the U.S. Census Bureau. The Census Bureau has reviewed this data product for unauthorized disclosure of confidential information and has approved the disclosure avoidance practices applied to this release. DRB Approval Number(s): CBDRB-FY20-CES007-004, CBDRB-FY21-CES007-004, CBDRB-FY22-CES008-008, CBRDB-FY23-CES020-001, CBRDB-FY23-CES020-002. DMS Project Number 7083300.
2 TFP attempts to measure the impact of technological improvement, including worker knowledge, on economic output.
3 Akcigit, U., and N. Goldschlag (2022) “Measuring the Characteristics and Employment Dynamics of U.S. Inventors,” Discussion paper, Center for Economic Studies CES-WP-2022-43.
-
Not all inflation is created equal. While the high inflationary period of the 1970s and 1980s was marked by stock market lows not seen since the Great Depression, recent upticks in inflation have been met by rising stock values. How stocks comove with Treasury bonds has shifted over time as well. These inconsistencies present a challenge to investors seeking to safeguard their portfolios against risk, as well as for policymakers aiming to understand how financial markets respond to shocks. Motivated by this, this paper offers a framework for understanding the implications of inflation.

The authors distinguish between inflation that is “good” and that which is “bad,” using prior research to show how the two have different sources and implications for markets. They establish the following concerning “good” vs. “bad” inflation:

This framework can help policymakers and investors draw more accurate conclusions about the sources and consequences of future bouts of inflation. While it is still too early to predict the impacts of the post-COVID pandemic surge, evidence from surveys and inflation swap markets suggest that inflation risk premia are narrow. The authors conclude by offering two interpretations of these early indicators: that of the optimist, who may be relieved that inflation risk remains small, and that of the pessimist, who may worry that markets outpace beliefs, often slow to update.
-
A growing body of evidence shows that sentiment and economic growth tend to rise and fall together. However, the channel of this correlation and potential causality are unresolved. Is sentiment related to fundamentals? Is sentiment a signal of future productivity but does not cause it? Does sentiment exert an immediate and lasting effect on economic growth through a self-fulfilling feedback loop? Given the many factors that impact economic activity, isolating the effects of consumer sentiment poses a challenge.

The authors propose a novel way to address these questions by analyzing data across sixteen countries with varying degrees of efficiency in their capital markets over the period 1975 to 2019. They hypothesize that countries with less efficient capital markets respond more strongly to sentiment shocks because investors are unable to distinguish between a change in fundamentals and a change in sentiment unsupported by fundamentals, a prediction that they exploit in their research design. The authors apply four different measures of efficiency of capital markets: inclusion in the G7 group, inclusion in the Eurozone, stock turnover over GDP, and per capita GDP. The authors study how economies of varying efficiency of capital markets respond to changing sentiment, and find the following:
- In countries with efficient capital markets, positive sentiment shocks increase economic activity only temporarily and without affecting total factor productivity. Sentiment shocks predict modest increases in consumption, employment, and income for two years.
- In countries with less efficient capital markets, sentiment shocks predict more prolonged economic growth and a corresponding increase in total factor productivity. Sentiment shocks predict large increases in consumption, employment, and income for four years.
- These effects are driven largely by financial markets: with positive sentiment driving up stock prices, investors are quick to take advantage of the lowered cost of capital. The authors observe increased capital investment and their associated rate of return following sentiment shocks.
- Countries with efficient capital markets exhibit a faster mispricing correction, lending support to the authors’ hypothesis that such markets are more efficient. As a result, sentiment is a negative predictor of returns.
- By contrast, countries with less efficient capital markets exhibit a slower mispricing correction because investors misinterpret consumer optimism as a signal about better investment opportunities. As a result, sentiment is a positive predictor of returns.
This paper offers new evidence on how sentiment impacts the economy. At least in countries with less efficient capital markets, sentiment appears to be a driver of economic booms. By contrast, sentiment shocks in countries with efficient capital markets leads to only short-term fluctuations that are unrelated to productivity. More broadly, this paper demonstrates how the financial sector influences economic growth.
-
That people experiencing homelessness have worse health outcomes than those who are housed is understood. However, the extent of this disparity, especially as it pertains to mortality, has not been examined nationally or with representative data. This paper addresses that gap by providing the first national calculation of mortality for people experiencing homelessness in the United States. In doing so, the authors provide novel insights into the health risks associated with homelessness.

To examine this phenomenon, the authors follow for 12 years 140,000 sheltered or unsheltered homeless people counted in the 2010 Census, by far the largest and closest to representative sample of this population ever analyzed. They compare homeless individuals’ mortality vs. the housed US population overall and for sub-groups defined by age, gender, race, Hispanic ethnicity, disability status, and income (in the latter case, to examine homelessness as a risk factor for mortality that is distinct from poverty in general). The authors further examine mortality differences within the homeless population by type of homelessness, geography, demographic characteristics, income, employment status, and the extent of observed family connections. Their findings include the following:
- Non-elderly people who have experienced homelessness face 3.5 times higher mortality risk than people who are housed, accounting for differences in demographic characteristics and geography.
- This disparity far exceeds the mortality gap between Black and white housed individuals (1.4), and between poor housed and all housed individuals (2.2).
- Importantly, homelessness is associated with 60 percent greater mortality risk than poverty alone.
- Homeless individuals’ mortality risk is four times higher in their 30s and 40s. Beginning in their 50s, homeless individuals’ mortality hazard begins to converge with people who are housed, which may reflect both excess mortality of exceptionally vulnerable homeless individuals at younger ages, and shared health vulnerabilities for elderly homeless and housed individuals.
- Black homeless individuals have about 27 percent lower mortality risk than white homeless individuals, perhaps related to the lower prevalence of substance abuse and behavioral health issues among Black homeless individuals, among other factors.
- Homeless individuals without formal employment, those with lower incomes, and those without observed family connections are especially vulnerable.
- Increased mortality risks also hold for sheltered homeless individuals, which illustrates the substantial health risks faced by people experiencing homelessness even when they are not sleeping on the streets.
- Finally, regarding COVID-19: Homeless individuals’ mortality rose by 33 percent during the pandemic. While the proportional rise in mortality risk was similar for people who were housed (29.8 percent) and poor and housed (33.9 percent), the pandemic affected a much larger share of the homeless population because of their substantially elevated baseline mortality risk.
Bottom line: This work shines a bright light on health issues related to homelessness, which has drawn renewed interest recently in light of the epidemic of deaths from opioids and the impact of COVID-19 on the homeless community. The authors’ findings are broadly summarized in one startling illustration: A 40-year-old homeless person has a mortality risk similar to a housed person who is nearly 60, and a poor housed person who is nearly 50. This fact, among the many others revealed in this work, not only adds to the emerging picture of the persistent hardships and stark health disparities associated with homelessness, but also informs future analysis of safety net and other programs meant to aid the homeless.
-
Researchers have long looked to parental income as a key factor in determining intergenerational mobility. However, parental income is not fixed over time, and parental expenditures on children change as a child ages, from predominantly food, health, and shelter when a child is young, for example, to education and neighborhoods through adolescence. As this new research reveals, taking a trajectories-based approach to income and expenditures delivers important new insights into intergenerational mobility.

The authors’ trajectories-based approach allows them to link parental income at each offspring age to the child’s future permanent income. Among other features of the authors’ methodology, their approach offers more precision when measuring age-specific parental income effects (please see the working paper for more details). The authors find the following:
- There is clear evidence that a child’s permanent income is sensitive to the timing of parental income: parental incomes in middle and late adolescence are associated with larger marginal effects on predicted offspring income than earlier parental income years. This is owing, at least in part, to the increasing role of education and social influences.
- The mobility process has changed across cohorts defined as births in 1967-1970, 1971-1973, and 1974-1977: the effects of a permanent parental income starting at birth are larger for the earliest cohort compared to the two later ones. In other words, the sensitivity of offspring to income in later childhood and adolescence seems to have declined relative to the first cohort.
- The authors uncover interactions between incomes at different ages as a distinct determinant of a child’s permanent income on parental income trajectories. In doing so, they find evidence of interactions between parental incomes at different ages in terms of their effects on children.
- Finally, in an important confirmation of their income results, the authors find that family income trajectories exhibit similar influences on education as they do for income; however, their results for occupations are mixed and imprecise.
Bottom line: Parental income plays different roles over the life of a child and, likewise, has different effects at given ages. This work reveals how the measurement of intergenerational mobility is enhanced by a consideration of how the dynamics of family income over childhood and adolescence predict adult outcomes. Importantly, for those interested in the role of parental income in intergenerational mobility, this work suggests an especially important role for incomes in adolescence.
-
Human capital was first popularized by Gary Becker, who compared individuals’ investments in education and training to those of businesses in machinery and equipment. Today, scholars studying human capital often aim to identify ways to bolster peoples’ life trajectories, such as through improvements in education or health. In this paper, the authors use data on workplace injuries to study how workers invest in human capital after losing ability, and to assess the effectiveness of human capital programs that aid those workers.
They begin by linking Danish injury claims data to information on workers’ health, education, receipt of government transfers, and employment. The authors restrict their sample to the subset of people who worked steadily until an accident limited their earnings. Their data reveal the following patterns:
- Most workers do not invest in human capital following an accident, with only 13% enrolling in a degree program at any level in the ten years following their injury.
- Among those who do invest, four-year bachelor’s programs are most common. Injured workers tend to pursue fields that are less physically demanding and more cognitively intense than their previous positions, often targeting degrees that build on their experience. For example, many carpenters obtain bachelor’s degrees in construction architecture.
The authors next turn to measuring the impacts of these investments. By comparing the outcomes of otherwise-similar workers who differ only in their eligibility for Danish degree programs, they find the following:
- Reskilling through higher education improves injured workers’ labor market outcomes considerably. Roughly 80% of injured workers who reskill find employment within seven years of their accidents, on average earning 25% more than before their injuries.
- Higher education appears to mitigate other hardships associated with workplace injuries as well. While workers who do not reskill receive disability benefits from the government and are often prescribed antidepressants, those who reskill do not experience an uptick in either.
- These increased tax revenues and decreased social expenditures mean that reskilling subsidies for injured workers pay for themselves four times over.
Given these benefits, should policies to increase the share of injured workers who reskill through higher education be implemented? To answer this question, the authors assess whether the returns documented above hold as more workers reskill. They find that the share of injured workers who reskill through higher education could be expanded considerably, from 11% to 33%, to maximize returns to workers and taxpayers. The case is even stronger for middle-aged workers, who tend to reskill at lower rates despite the benefits.
The upshot is that higher education is effective at helping manual workers reskill and shift occupations. Policies that expand access to higher education could help alleviate displacement shocks to manual occupations, such as automation or globalization.
-
Women experience on average worse economic outcomes than men, from lack of basic freedom to work outside the home in some contexts to persistent underrepresentation in public and private leadership positions around the world. It is now well understood that gender norms shape some of these outcomes. More recently, economists have begun to recognize that perceived gender norms may play an important role, too: people may make incorrect assumptions about the support for gender equality or the degree to which it already exists, and such assumptions can restrict progress.

For example, recent work by one of two of the authors of this new research, UChicago economist Leonardo Bursztyn and David Yanagizawa-Drott from Zurich (together with UChicago’s Alessandra González) reveals that the vast majority of men in Saudi Arabia privately support women working outside the home, but underestimate the extent to which others share this view (see BFI Research Brief and Working Paper “Misperceived Social Norms: Women Working Outside the Home in Saudi Arabia”1). The authors show that a simple policy intervention corrects such misperceptions and leads to a significant increase in women’s involvement in labor markets. If men are informed, for example, that other men share their views, then such ideas become more publicly acceptable and, thus, advance change for women.
However, do these findings hold across space? Do they only apply to the particular cultural constructs within Saudi Arabia, or do they hold for all countries, even those with more gender-equal norms? To address these and related questions, the authors of this new research employ a novel dataset from 60 countries, as a new module of the Gallup World Poll 2020, representing over 80% of the world population. The survey measures the respondents’ support for two distinct policy-relevant issues: 1) whether women should be free to work outside of their home (basic rights), and 2) whether women should be given priority women when hiring for leadership positions (affirmative action). Crucially, the survey also measures perceived norms, i.e., what each respondent thought the support for these issues people in their country is. Perceptions were elicited separately for the support among men and the support among women. This novel dataset reveals the following insights:
- There is widespread support for women’s basic right to work outside of the home across the world: a majority of the population is in favor in all 60 countries, often by a wide margin. Importantly, while the share of women in favor is essentially always higher, a majority of men favor women’s basic rights in all countries.
- In all countries in the sample, respondents on average underestimate the extent to which people in their country support women’s basic right to work outside the home, and particularly men’s support. These findings are in line with what documented in Saudi Arabia, but on a global scale.
- Regarding affirmative action, the authors find majority support from both men and women in 37 countries, while in 12 countries a majority of both do not support it. Further, affirmative action for women is strongly negatively associated with the level of gender equality in the country, with, on average, the majority of the population being against affirmative action for women in the most gender-equal countries. Similar to basic rights, more women than men support affirmative action for women in virtually all countries.
- Perceptions of others’ support for affirmative action exhibit a perhaps surprising pattern. Just as for basic rights, in less gender-equal countries, men’s support is systematically underestimated. In more gender-equal countries, women’s support is instead systematically overestimated.
- The authors also consider potential mechanisms that could be driving the documented misperceptions and find two nearly universal forces at play: the overweighting of the minority view and widespread stereotyping of men and women.

Bottom line: Around the world, people underestimate support for basic women’s rights. This work reveals that restricting female employment based on perceived peers’ opinion is likely acting erroneously. Aligning perceived and actual views, then, may raise female labor force participation outside the home by shifting perceived social norms in a way that is actually consistent with the underlying opinions of a society. The implications for affirmative action are less clean-cut, but the study suggests that in countries like the United States, women may be substantially less in favor of such policy than widely believed (for example, women may infer that affirmative action will devalue their achievements.) Finally, while heterogeneity across countries does not lend itself to broad policy prescriptions, the authors’ methodology offers interventions that could align actual and perceived norms, and thereby move countries to embrace greater gender equality.
1 Published in the American Economic Review (2020), 110(10): 2997-3029.
-
Firearm regulations are subject to fierce political debate in the United States, with common policy proposals ranging from sweeping bans to open markets. Most research on the matter has focused on crime, with researchers often assessing the extent to which historical policy changes have or have not reduced gun crimes. This paper offers a new framework for evaluating gun regulations that incorporates the preferences of the consumer.
To understand the advantages to this approach, consider a hypothetical gun buyer. How will they respond to a price hike on their preferred firearm? Will they opt for a different (possibly deadlier) model? Or will they abstain from purchasing altogether?
Accounting for consumers’ preferences can help policymakers evaluate how well different policies will achieve their intended goals and at what cost to gun owners. Motivated by this, this paper estimates a full demand system for firearms.

The authors use a special survey, called stated choice based conjoint analysis, to collect data on consumer demand for firearms. They present respondents, who are drawn from the general public, with a series of hypothetical gun purchasing scenarios in which prices and options are set experimentally. The authors apply the resulting data to a demand model, which they validate by comparing its outputs to external data including background checks and prices. Their analysis reveals the following:
- Gun buyers aren’t very responsive to price changes, but demand for handguns is most price sensitive.
- There is considerable substitution from assault weapons to handguns, but very little substitution from handguns to assault weapons.
- Those considering purchasing their first gun tend to be more sensitive to price increases and also tend to prefer handguns more than repeat buyers.
What do these substitution patterns mean for policy? The authors conclude by using their demand model to predict the impacts of three policy scenarios: an assault weapons ban, a handgun ban, and a tax that increases the price of all firearms by 10%. They find the following:
- Banning assault weapons would lead more consumers to purchase handguns, the type of weapon involved in the majority of gun deaths.
- By contrast, banning handguns would lead to fewer firearm sales overall. A handgun ban would also result in a large reduction in consumer surplus to the many buyers who prefer handguns, a tradeoff that may limit the political feasibility of the policy.
- A 10% price increase would lead to only a small reduction in sales, suggesting that while the policy might have limited scope for reducing firearm purchases, it could generate tax revenue.
- The authors also use their demand estimates to forecast the cost of a gun buyback program. They predict that it would cost roughly $6,499 per gun to incentivize the majority of gun owners to relinquish their recent purchases.
Bottom line: This paper makes the case for incorporating consumers’ preferences in the consideration of firearm regulations. The authors’ findings concerning price sensitivity and substitution patterns have immediate impacts for policy. More broadly, their framework can be used to assess the cost and benefits of candidate firearm regulations beyond those considered here.
-
Rural Americans have worse health outcomes, yet doctors are disproportionally concentrated in large cities. For many, this long-observed phenomenon indicates that doctors are not distributed appropriately across space. Many healthcare policies have sought to “correct” this distribution. However, this new research shows more at play when considering the optimal delivery of medical services. A more complete evaluation considers two economic mechanisms crucial to understanding spatial patterns of US healthcare delivery: economies of scale and trade costs.
When the authors discuss economies of scale in medical services delivery, they are referring to classic ideas in urban economics about the benefits of geographically concentrated production. If many hospitals and doctors are located near each other, they can see more patients, specialize, and gain experience that benefits patients. They can disseminate information on the latest innovations and share the cost of specialized equipment. In other words, this spatial concentration has benefits—and especially for the people who live nearby and can easily access this high-quality care.

What about those living in rural areas, far removed from large medical centers? One way to get these patients healthcare is to distribute medical service production, including doctors, to those rural areas and forgo the benefits of scale. This is natural for time-sensitive emergency care. However, what about most other types of health care, including specialty treatments, that are scheduled in advance? Do we need a hospital with specialty practitioners in every town? Or is it better for patients to travel to big cities to see more experienced, specialized providers? If patients can travel, medical care faces a proximity-concentration trade-off like other tradable industries. In other words, patients who travel for medical services produced elsewhere incur travel costs, but they also benefit from economies of scale.
The authors assess these issues by employing Medicare claims data to quantify the roles of increasing returns to scale and trade costs in medical services. They show that larger markets produce higher quality medical services. They also show that “imported” medical procedures—defined as a patient’s consumption of a service produced by a medical provider in a different region—constitute over one-fifth of US healthcare consumption. Patients in smaller markets are the largest consumers of imported healthcare. It follows that “exports” of medical services—including specialized care—are disproportionately produced in large markets. These patterns reflect economies of scale: larger regions produce higher-quality services because they serve more patients.
The authors employ a rich dataset of millions of patient-provider interactions. They quantify how production subsidies and travel subsidies affect patients’ access to care and the quality produced in each region; the working paper describes these methods in detail. Their findings include the following:
- Production is more geographically concentrated in large markets than consumption. Since trade constitutes the difference between production and consumption, trade reduces geographic inequality in medical care access. A key implication is that common measures of healthcare production (e.g., doctors per capita) will overstate inequality in the healthcare people actually receive.
- In a theoretical model, local increasing returns to market scale can generate a home-market effect, i.e., exports of medical care rise as a region grows larger, even when prices are fixed. The authors’ model predicts that larger markets will become net exporters of medical services when local increasing returns to market scale are sufficiently strong.
- This phenomenon is borne out in the data. Local increasing returns to market scale are so strong that greater demand induces a larger increase in exports than imports. This makes larger markets net exporters of medical care and means that healthcare can serve as an export base for large urban economies.
- Larger markets produce higher-quality services thanks to economies of scale. How do we know these services are higher quality? Patients are willing to travel more to get services in these regions, all else equal. In addition, patients’ willingness to travel (revealed preference) corresponds with other measures, like US News hospital rankings.1
- A region’s quality rises considerably with the regional volume of production. While there could be many mechanisms driving this, the authors find that, in large regions, doctors are more specialized, procedures are performed by more experienced doctors, and more unique services are offered.
The authors emphasize differences between the markets for rare and common procedures.
For example, compare patients with heart failure who have left ventricular assist devices (LVADs) implanted to augment cardiac function—a rare procedure—with those who have routine screening colonoscopies. Half of the patients receiving LVAD implants come from outside the surgeon’s region, but only 15 percent of routine screening colonoscopies are performed on patients outside their home region. Their analysis reveals the following about rare procedures:- Trade and market size play a larger role for rare procedures: The imported share of consumption is 22% for common procedures and 35% for rare procedures.
- The home-market effect is substantially stronger for rare procedures: a larger residential population drives a greater increase in exports for rarer services.
- The geographic scope of the market for a medical procedure depends on its national scale: doctors performing rare procedures export their services across a broader geographic scope, sometimes serving patients who reside thousands of kilometers away. Rarer procedures are disproportionately produced and exported by large markets.
Next, the authors explore the trade-off created by putting providers proximate to patients, which also fragments the production of medical services. They find that reimbursement policies vary in how they affect patients and providers. They also affect regions differently depending on their size and trade patterns. In particular:
- A nationwide increase in reimbursements generates the largest increases in local medical care quality in the smallest regions. However, these regions’ patients experience the smallest increase in the value of market access because they consume less of their care locally.
- Reimbursement increases generate the highest return when spent in the largest cities.
But this finding comes with an important caveat: the higher-quality care available in larger markets may not benefit all patients equally. The authors show that:
- Socioeconomic status predicts how patients trade off travel costs and the benefits of scale. Patients residing in lower-income neighborhoods are less likely to travel farther for better medical care. This finding reveals that all patients do not benefit equally from local increasing returns to scale.
Bottom line for policymakers: Healthcare produced in large regions is higher quality. Policies to reallocate care to smaller regions may impact patients’ access to healthcare in unexpected ways. Traditional production subsidies in small, underserved areas help healthcare producers (e.g., doctors) more than patients in those areas. Patient travel also plays a meaningful role in enabling access to higher-quality, more experienced, and specialized care. Policymakers should consider travel subsidies rather than only production subsidies to increase access to care for underserved patients.
1 health.usnews.com/health-care/best-hospitals/articles/faq-how-and-why-we-rank-and-rate-hospitals
-
For all of its empirical and theoretical rigor, science often begins with an intuition or inspiration. Long before a new idea becomes a paper that appears in an academic journal, for example, it begins as a hypothesis. These creative suppositions commence with “data” stored in a researcher’s mind, which she then “analyzes” through a purely psychological process of pattern recognition. The “aha” moments that may follow are not necessarily inspiration, but rather the output of the researcher’s brain-driven data analysis. In other words, scientific contributions often derive from a researcher’s idiosyncratic and very human thought process.
Given the importance of scientific research and its many benefits, this raises a question: Is there a better way to generate hypotheses other than a reliance on personal analytical insight? This novel paper examines this question through the lens of machine-learning algorithms and the exploding availability of human behavior data. Second-by-second price and volume data in asset markets, high-frequency cellphone data on location and usage, CCTV camera and police “bodycam” footage, news stories, children’s books,1 the entire text of corporate filings, and so on, is now machine readable. What was once solely mental data in the service of hypothesis generation is increasingly becoming actual data.
The authors posit that these changes can fundamentally change how science gets done, which they demonstrate by developing a procedure that applies machine learning algorithms on rich data sets to generate novel hypotheses. Please see the working paper for more details, but broadly described, the authors extend the human process of generating data-driven correlations to supervised machine learning. Their new approach not only yields far more correlations than a human researcher, but it has the capacity to notice correlations that a human might never discern. This is especially true in high-dimensional data applications, potentially opening the door to research that would otherwise go unexplored.
To illustrate their procedure, which is applicable across disciplines, the authors study a high-stakes issue with profound implications: How pre-trial judges decide which defendants awaiting trial are incarcerated and which are sent free. These decisions are supposedly based on predictions of a defendant’s risk, but mounting evidence from recent research suggests that judges make these decisions imperfectly. In this case, when the authors build a deep learning model of the judge—one that predicts whether the judge will detain a given defendant—a single factor has large explanatory power: the defendant’s face.
The authors find the following:
- A predictor that uses only the pixels in the defendant’s mugshot explains from one-quarter to nearly one-half of the predictable variation in detention.
- Defendants whose mugshots fall in the bottom quartile of predicted detention are 20.4 percentage points (pp) more likely to be jailed than those in the top quartile.>
- By comparison, the difference in detention rates between those arrested for violent versus non-violent crimes is 4.8 pp.
It is important to note what this work does not reveal. The authors do not claim that a mugshot predicts a defendant’s behavior; rather their analysis reveals that mugshots predict a judge’s behavior: A defendant’s appearance correlates strongly with a judge’s decision to jail or not. And what are those appearance characteristics? There are two, and the authors label the first as “well-groomed” (e.g., tidy, clean, groomed, vs. unkempt, disheveled, sloppy look), with the second as “heavy-faced” (e.g., wide facial shape, puffier face, rounder face, heavier). Importantly, these features are not just predictive of what the algorithm sees, but also of what judges actually do:
- Both well-groomed and heavy-faced defendants are more likely released.
- Detention rates of defendants in the top and bottom quartile of well-groomedness differ by 5.5 pp (24% of the base rate) while the top vs. bottom quartile difference in heavy-facedness is 7 pp (about 30% of the base rate).
- Both differences are larger than the 4.8 pp detention rate difference between those arrested for violent vs. non-violent crimes.
Again, please see the working paper for the authors’ careful consideration of the many factors involved in their analysis, including their discussion of the ways that psychological and economic research over the past century has informed our understanding of people’s reaction to faces, including on such factors as race. The point here is that the authors’ algorithm seems to have found something new, beyond what scientists have previously hypothesized, and beyond human capability.
Bottom line: Hypothesis generation matters, and developing new ideas need not remain an idiosyncratic or nebulous process. The authors’ framework reveals that combining supervised machine learning with rich human behavior data can open the scientific world to new and fruitful lines of research. The authors’ example of judicial decision-making, along with other applications that they describe, are just the beginning. Future research will help move hypothesis generation from a pre-scientific to a scientific activity.

1 See “What We Teach About Race and Gender: Representation in Images and Text of Children’s Books,” by Anjali Adukia, et al., for a BFI Research Brief and links to the paper, an interactive tool, and video presentation.
-
The post-pandemic shift to hybrid work has revolutionized working arrangements, with US survey data revealing that one-quarter of full workdays will happen at home or other remote location after the pandemic ends, five times the pre-pandemic rate (see “Why Working From Home Will Stick”). This phenomenon, in other words, is large and enduring, and also extends beyond the United States.

In this new work, the authors shed light on work-from-home (WFH) by studying information contained in the full text of over 250 million job postings in five English-speaking countries. The authors employ state-of-the-art language-processing methods to determine whether a job allows for remote work, including identification by city, employer, industry, occupation, and other attributes. Data include almost all vacancies posted online by job boards, employer websites, and vacancy aggregators from 2014 to 2022 in Australia, Canada, New Zealand, the United Kingdom, and the United States. Importantly, vacancy postings pertain to the flow of new jobs rather than the stock of existing jobs. This is key because these new jobs entail a commitment—or at least a statement of intent—that extends into the future. (See WFHmap.com for updated, and available, data.)

The authors’ findings include the following:
- Before the pandemic in 2019, jobs offering remote work were 1% or less of all job ads in Australia, Canada, and New Zealand, about 3% in the United Kingdom, and about 4% in the United States.
- From 2019 to 2022, remote-work share rose more than three-fold in the United States and five-fold or more in the other countries.
- As of January 2023, the remote-work share exceeds 10% of postings in Australia, Canada, the United Kingdom, and the United States, and it appears to be on an upward trajectory in all five countries.
- Remote-work share correlates positively with computer use, education, and earnings, with Finance, Insurance, Information, and Communications sectors having especially high remote-work shares.
- Relatedly, Chicago, London, New York, San Francisco, Toronto, and other cities that function as business service hubs have high remote-work shares, and these differences have widened since the pandemic struck.
- Finally, this work reveals that the shift to remote work is not uniform across same-industry employers, even when they are recruiting in the same occupational category. As a result, workers now have expanded opportunities to find a job with working arrangements that suit their preferences. Importantly, this non-uniformity result also suggests that remote work is not constrained by technology; rather, it is an outcome of choices about job design and organizational management. In turn, these job design and management choices are influenced by the external environment and subject to shock-induced shifts.
A concluding note on methodology: Large-scale studies like this are not possible without machine-reading technologies that accurately discern relevant information. The authors improve upon existing methods by developing a first-of-its-kind algorithm that they label WHAM, or “Work from Home Algorithmic Measure,” to classify their 250 million job postings. WHAM achieves near-human performance in classification tasks (for example, when answering the question: “Does this text explicitly offer an employee the right to remote-work one or more days a week?”). In doing so, WHAM substantially outperforms existing methods, including the language models that underlie GPT-3 and ChatGPT, and offers future research opportunities to further explore questions surrounding the emerging WFH phenomenon.
-
Large US firms often view bankruptcy as a strategic option when facing distress, for example, by utilizing a Chapter 11 filing (reorganization) vs. Chapter 7, liquidation. As such, corporate bankruptcy can be thought of as part of the social safety net, providing some insurance against negative outcomes and giving entrepreneurs and capital providers the confidence to take risks and make important investments.
However, such benefits may prove elusive for many small and medium-sized firms, which may be unaware that bankruptcy can provide protection, for example, so a firm can negotiate with creditors to remain in business. Despite efforts to make bankruptcy more accessible and less costly for small businesses, including the February 2020 passage of the Small Business Reorganization Act (SBRA), little is known regarding small firms’ knowledge about bankruptcy. Further, the popular phrase “going bankrupt” is synonymous with closing one’s business and not preserving it, and may also suggest a commonly held stigma associated with bankruptcy that could further dissuade small- and medium sized firms from exploring its benefits.

This research examines the relationship between small- and medium-sized firms and bankruptcy by posing three questions: First, do small businesses exhibit lack of information and stigma about bankruptcy? Second, if so, is it possible to reduce the lack of information and stigma, both immediately and in the long run? Third, what are the implications for firms of reducing information unawareness and stigma?
To answer these questions, the authors conduct a novel large-scale randomized controlled trial (RCT) with US small businesses. In partnership with SCORE, the leading US organization dedicated to mentoring small businesses at all stages of development, the authors surveyed about 1,500 firms in fall 2020. Please see the working paper for more methodological details, but broadly speaking, two groups of firms were given hypothetical scenarios about a struggling business owner, with one group receiving additional information about the differences between Chapter 7 and 11 bankruptcy, or additional information that addresses stigma, including information that bankruptcy protection is fundamental to US law and is part of the US Constitution. Questions to both groups reveal the following:
- Among respondents in the Control group, almost half of the firms are unaware that it is possible for a firm to continue operations after filing for bankruptcy. Only 34% are familiar with the differences between Chapter 7 and Chapter 11 bankruptcy, and only 11% are aware that the SBRA (which was passed 9 months prior to our survey and was highly publicized) made it easier for small businesses to file for bankruptcy.
- Regarding stigma, 70% of the respondents in the Control group believe that business owners who file for bankruptcy are viewed as failures. Almost two-thirds of respondents feel that friends and family will look down on a business owner who files for bankruptcy, and over half of the entrepreneurs agree that clients and employees will be less willing to work with a business owner who has filed for bankruptcy.
- The information treatment increases the share of firms recognizing the possibility of “life after death” by 25 percentage points (pp), increases the share of firms that know that Chapter 11 is the type of bankruptcy that allows firms to continue operating by 45pp, and increases the share of firms that are aware of the SBRA by 65pp. Importantly, these effects remain strong after 4 months.
- Viewing a video about stigma greatly reduces its effects, a result that holds over the short run.
- The two treatments (Information and Information+Stigma) led firms to increase their immediate willingness to consider bankruptcy, intended investment, and intended risk-taking.
- Finally, and somewhat surprisingly given the above findings, the authors do not see longer-run real outcomes from their treatments, nor do they observe any firm actually filing for bankruptcy. The authors’ explanation of this phenomenon includes the behavioral role of entrepreneurs’ overconfidence and, to a lesser extent, excessive perceived legal fees as explanations.
Bottom line: This work reveals a stark reluctance by small businesses to take advantage of the bankruptcy protection system. For policymakers, the authors’ treatments inform potential designs for policies that attempt to further increase the use of the bankruptcy system by small businesses.
-
Key among the factors that influence whether a child grows to become an inventor are innate ability and social environment, including family resources and parental education. Parental income is a good predictor, with Figure 1 showing the relationship between the probability of off-spring becoming an inventor and parental income, using recent and historical US and Finnish data.

Why compare the United States and Finland? Because the two countries illustrate an enigma: Unlike the US, Finland displays low income inequality and high social mobility. Likewise, one would expect that income would play less of a role in Finland, with its more egalitarian society and equitable educational system.
To address this Finnish puzzle, the authors examine the little-understood role of parental education on the probability of their offspring becoming inventors. Please see the working paper for details on the authors’ methodology but, broadly speaking, they merge four datasets that include individual data on 1.45 million Finns and their parents (including, for example, parents’ distances to the nearest university at age 19), and individual-level patenting data, along with other factors, to find the following:
- While parental income is positively associated with the probability of becoming an inventor, that effect is greatly diminished once parental education is controlled for. Given that parental education is unevenly distributed, this finding informs the Finnish enigma. Moreover, as shown in Figure 2, higher parental income is positively correlated with parental education.
- Parental university education has a large, positive local average treatment effect (LATE) on the probability of a child becoming an inventor. Also, while the causal impact of parental education on sons is higher than that on daughters, the impact relative to the baseline is larger for daughters.
- The average treatment effects on the treated (ATTs) are similar to LATEs, but those on the untreated are roughly one third lower. The ATTs suggest a significant impact of parental education on the offspring, e.g., the probability of a son becoming an inventor increases by a factor of four compared to the sample average.
- Finally, Finland’s education reform implemented in the late 1960s, wherein the establishment of new universities improved parents’ ability to access higher education, has reduced the causal impact of parental education and income on the probability of inventing. In so doing, Finland both stimulated aggregate innovation and made growth more inclusive by allowing more talented individuals with low-educated parents to become innovators. Put another way, access to parental education has reduced the number of “lost Einsteins and Marie Curies” in Finland.

Bottom Line: Invention spurs growth, and a country that massively and persistently invests in education up to (STEM) PhD level can significantly increase its aggregate innovation potential, while also making innovation-led growth more inclusive. This work shows that while income matters in determining whether offspring become inventors, education is a great equalizer. Evidence from Finland, a country with low income inequality, reveals that the establishment of new universities allows higher-ability parents to study in a university, which enhances both the parents’ and their children’s human capital and skill formation in a way that increases the capacity of the offspring to invent.
-
Customer bias can take a toll on workers who are evaluated on customer service. Over time, worker performance may suffer, impacting their productivity and ultimately their pay and advancement opportunities. For firms, customer bias can be a factor in hiring and promotion decisions, while for regulators it can influence their understanding of the effects of certain policies, like performance-based pay. Despite these and other known consequences of customer bias, little is known about the magnitude of these effects.
To address this gap and the challenges of measuring the impact of customer bias (including subjective data, multiple factors like skill levels and workplace environment, and testing across equally productive individuals), the authors run the first randomized field experiment on customer discrimination for workers within a firm. They partner with an online travel agency with offices across Sub-Saharan Africa that sells flights and hotels, and that hires local sales agents to assist customers. The authors study over 2,000 customers from 70 countries (87% from Africa, 13% abroad) as they chat with online sales agents who answer their questions and help them make purchases. This allows the researchers to precisely measure worker productivity through sales records and document rich patterns of customer engagement, including bargaining and harassment, through chat transcripts.
Please see the working paper for more details on methodology, but broadly speaking the authors apply a novel framework for estimating the causal effect of customer-based discrimination, which includes randomization of the worker names and implied genders that customers see, while blocking this information from the workers themselves. Consequently, any change in consumer behavior toward sales agents could only occur if consumers respond to the randomly assigned names. This work improves upon the limitations of existing research that includes actors and fictitious scenarios to uncover bias, to find the following striking results:
- Randomly assigned female names reduce the likelihood that customers make any purchase, the number of purchases customers will make, and the value of those purchases.
- Specifically, the likelihood of any purchase decreases by 3.8 percentage points, or 50% relative to the baseline purchase rate (7.6%).
- There are similarly large reductions in the total number of purchases, the total value of purchases and the average purchased price conditional on any purchase.
- Customer disinterest is apparently driving these effects; customers lag in responding to female agents and are less likely to transition from their initial inquiry into a discussion about purchasing.
- Finally, the authors do not find evidence that customer disinterest extends to harassment or differential bargaining.
Identifying the existence and extent of customer discrimination in a real-world setting is important for two reasons. First, this work shows that customer-based discrimination will not be competed away in equilibrium because firms internalize their preferences. And second, hypotheses that workers may sort away from industries in which they face customer discrimination, thereby limiting its impact, do not appear to hold in this setting. More broadly, if women are unable to avoid customer discrimination through sorting, this may present a barrier to female labor force participation, and introducing a persistent labor market distortion.
Bottom line: Customer discrimination and its effects are real, and their effects often go unnoticed by firms and econometricians alike. Also, the authors discuss that the findings described in this work likely extend to other service industries and to other locations around the world. For policymakers, the authors offer two approaches. The most direct is to change customer norms around women in the workplace by, for example, using programs to increase the representation of women in positions of power, or convincing firms that they could capture future benefits by sensitizing customers to female workers. Another approach could attempt to limit the consequences of customer-based discrimination on female employees by eliminating agent names or using gender-neutral names.
-
One important effect of bank supervision is its effect on credit supply. Do certain supervisory practices influence loan supply? How do supervisory regime shifts, say, to more rigorous practices, affect credit supply? For example, recent research finds that internal lending practices among banks following a supervisory regime shift exhibit a pronounced increase in the amount and type of complex lending, such as lending to small businesses.
This work extends this literature by investigating how US banks’ mortgage lending to minority borrowers, relative to white borrowers, changes following the resolution of severe enforcement decisions and orders (EDOs). EDOs are issued against financial institutions for unsafe or unsound practices; breaches of fiduciary duty; and violations of laws, rules, or regulations. The intuition for this study is similar to that described in the example above: Just as rigorous supervisory practices have been shown to increase small business lending, stricter bank supervision should also lead to loans for other complex borrowers, such as minority borrowers whose credit risk is more challenging to evaluate.

Regarding racial disparities in mortgage lending, the authors are particularly interested in which administrative controls, in the form of loan and internal governance policies and adherence to such policies, serve as mechanisms through which EDOs transmit their effect on lending outcomes. Recent research finds some support for this mechanism, showing that racial disparities can derive from the biases of individual loan officers and limitations on the scope of borrowers’ information used in the lending decision.
To what degree, then, do post-EDO bank management policies address these issues and lead to better outcomes? The answer is important because banks’ credit allocation decisions are crucial and have critical socio-economic implications. To this point, though, our understanding of the impact of administrative controls on banks’ lending decisions is limited. This paper addresses this gap by examining the extent to which EDO banks’ minority lending changes in the five years following the resolution of the EDO, to find the following:
- EDO banks significantly increase their mortgage lending to minority borrowers relative to white borrowers following the termination of an enforcement order. Specifically, the share of residential mortgage lending to minority borrowers in EDO banks’ total residential mortgage portfolio, measured at the county level, increases by 2% to 7% after EDO termination.
- EDO banks increase their market shares of mortgage lending to minorities relative to all banks in a given county following EDO termination. Relative to the pre-EDO period, EDO banks’ market share of mortgage lending to minorities increases by 0.58%–0.62%. On average, EDO banks’ market share of lending to minorities in the residential mortgage market is 0.41%, making the increase economically significant.
- Increases in minority lending are significantly higher for EDOs that specify revisions of loan policies and or implement more formal internal governance procedures in counties with a higher proportion of subprime borrowers.
- Regarding the effect of supervisory enforcement, the authors find that the increase in minority lending is greater for banks with stricter regulators.
- Banks with more severe EDOs or with low CRA ratings expand their minority lending more after exiting EDOs.
- On the question of how corrective actions directly influence loan approval decisions, the authors find that mortgage loan denial is 9.6% more likely for minority borrowers relative to white borrowers prior to an EDO. However, following EDO termination, the likelihood of denial decreases by five percentage points for minority borrowers.
- Finally, regarding specific loan denial reasons, relative to the pre-EDO period, the rejection of minority loan applications due to borrower credit history is 3.4% less likely following EDO termination.
Bottom line: Supervisory enforcement matters. The authors’ finding that banks increase lending to minority borrowers relative to white borrowers following the resolution of EDOs, has important implications for policymakers. Specifically, this work reveals that proper bank administrative controls are critical to enhancing access to mortgage credit for minority borrowers.
-
Prominent among the counterintuitive insights gleaned from behavioral economics is that we often do not choose what we really want. For example, when thinking fast (automatically), cognitive biases take hold and we may choose the donut from the breakfast buffet, but when thinking slow (deliberately) we may choose the banana. In this case, it can be inferred that the banana is our true preference (more on that in a moment).

Now imagine that the buffet table is actually Facebook, and the social media platform is offering choices that are curated by an algorithm based on our automatic thinking, meaning that the movies, news stories, posts, books, websites, and so on that Facebook offers us may not reflect our true preferences. In other words, the choices that algorithms offer, which are inferred by reliance on past data and ranked accordingly, are not entirely of our own making. Likewise, when we act automatically on those ranked offerings, we will reinforce the algorithm’s choices and the cycle will continue. In such a scenario, our true preferences are often unmet.
This paper explores the implications of this phenomenon in the context of one kind of automatic bias of particular social concern: discrimination. Before describing the authors’ methodology and findings, a brief note about terminology: The authors term fast or automatic choices as “system 1” decisions, and more carefully considered choices as “system 2” decisions that likely reflect true preferences. Now, about those “true” preferences: the authors acknowledge that we cannot definitively know what someone truly wants, so by “preferences” the authors are using shorthand for system 2 decisions, given their more considered nature.
Regarding discrimination, algorithmic automaticity can induce prejudice above and beyond any explicit preference because many of the forces that create discrimination operate quickly, via stereotypes or gut responses, and can therefore exert stronger influence over automatic choices. Because behavior is a combination of two distinct forces — prejudice that arises from system 2 and system 1 decisions — the issue at hand is the additional bias created by automaticity. Algorithms try to infer preferences from our behavior but the influence of system 1 as reflected in that behavior can lead the algorithm to codify unintended bias. Importantly, the magnitude of that source of bias is not fixed: algorithms will inherit more bias when trained on more automatic behaviors, which the authors describe as particularly troubling because algorithms are often trained in contexts (e.g., social media) in which people behave fairly automatically. Thus, the cycle not only continues, but it also intensifies.
The authors focus on one particular kind of prejudice: the tendency of people to favor those like themselves (“own-group” members) and to disfavor unlike people (“out-group” members). The authors then test the implications of this model in two ways that, together, tell a powerful story. Importantly, the prediction tested here is not so much just about the presence of algorithmic bias, but rather whether the magnitude of such bias will be relatively larger for algorithms trained using behavioral data that are relatively more automatic.
Test #1: Lab Experiment
Subjects are asked to select movies recommended to them by strangers who are randomly assigned an indicator (name) of own- versus out-group status. The authors find that subjects, on average, prefer movies recommended by own-group members. Consistent with the authors’ theory, this own-group bias is especially pronounced when choosing in the randomly assigned “rushed” condition.
The authors then take the data from the lab experiments – the data from subject’s responses – and use that as a training dataset to build a recommender algorithm. They find that this type of algorithm exhibits more out-group bias in rank-ordering movie reviews when trained using data from the lab experiment’s rushed condition than the non-rushed condition. In fact, the algorithm results in even more detectable bias than in the subject responses themselves.
Test #2: Facebook algorithms
To understand the potential real-world implications of these findings, the authors audited two Facebook algorithms: News Feed, which ranks the posts of a user’s friends, and People You May Know (PYMK), which ranks potential new friends.
In the first case, when subjects are asked to report on their desire to view a post in the News Feed, their responses are positively correlated with News Feed rankings. However, the authors also find a statistically significant (and sizable) difference in rankings for own- versus out-group posts as defined by race, even conditional on user preferences (e.g., for a white Facebook user, Facebook downranks posts from Black friends).
The authors then collected data on user preferences and the algorithm’s ranking of candidate friend recommendations from PYMK friend recommendations to find that there is no detectable out-group bias in these rankings. What explains this difference from the News Feed findings? The authors employ a variety of metrics to show that users report more automatic behavior when scrolling through posts (the data used to train News Feed) than when scrolling through potential friends (PYMK data).
Similar results hold in the single largest Facebook market in the world, India, where the context for own- and out-group bias is not race but, rather, religion (Hindus vs. Muslims). News Feed rankings are biased against posts by Hindu friends of Muslim users, and biased against posts by Muslim friends of Hindu users, with no detectable evidence of bias with the PYMK algorithm.
Bottom line: Consistent with their theory, the authors find that while the News Feed rankings (derived from relatively more automatic behavioral data) show signs of out-group bias, they find no detectable disparity in the recommendations of the PYMK algorithm (built with less automatic behavioral data). These findings make clear that the design of human-facing algorithms must be as attentive to the psychology and behavioral economics of human users as to the statistical architecture and machine learning engineering of the algorithms. Put another way, more attention must be paid to what behaviors are included in the training data used to construct algorithms, especially in online contexts where so much measured behavior is likely automatic.
-
What are the effects of financial ties between drug companies and the medical community? On the one hand, financial ties between drug companies and medical researchers might bias researchers’ judgments about the company’s drugs. Studies have shown that clinical trials funded by drug companies are more likely to find favorable treatment effects. This problem suggest an easy fix: Ban all financial ties between drug companies and researchers.
On the other hand, such financial ties can produce benefits. For example, about two thirds of the roughly $200 billion in annual US medical research is funded by drug companies and, in 2014, pharmaceutical money funded 6,550 human trials as compared to 1,048 by the National Institute of Health. Besides, so many doctors have ties to drug companies that attempts to ban conflicted doctors from medical journals and advisory committees left those journals and committees wanting for contributors, and such bans were subsequently relaxed.

An alternative to a ban on financial ties is to disclose such conflicts to relevant parties. Such a policy allows readers to interpret findings in light of perceived conflicts and to discount articles with such conflicts, while also providing researchers with incentives to choose financial ties with drug companies judiciously. Disclosure regulation is often viewed as preserving the potential benefits of financial ties between drug companies and the medical community, while also addressing concerns about possible conflicts of interest.
Is such disclosure regulation effective? The authors of this new work acknowledge that this is still an open question, but they offer a unique method to examine the question: They study whether conflict of interest disclosures in scholarly articles in medical journals affect citations to those articles by other medical researchers. Some prior research suggests that doctors view hypothetical articles more negatively if they disclose drug company funding. This new research offers evidence on actual behavior toward actual articles (what economists call a revealed-preference approach). Specifically, they infer from citations the potential “discount” that fellow researchers attach to articles by authors who have conflicts. Moreover, citation behavior is economically important: they are employed by universities in making tenure and salary decisions.
The authors test the relationship between the disclosure of financial ties and citations by using data on over 17,000 research and review articles in seven medical journals from 1988 to 2008, when disclosure of conflicts substantially increased because medical journals introduced conflict of interest disclosure policies. A challenge to estimating the impact of disclosures on citations is selection bias: drug companies seek out and fund higher-quality authors because those individuals typically garner more citations. This selection can generate a positive relationship between disclosures and citations, and mask any negative causal effect of disclosures on citations due to readers discounting the information value of articles by conflicted authors. The authors confirm this positive association is due to selection. To determine whether readers discount articles with conflicts, they perform three tests to filter out selection and find the following:
- First, they examine review articles, which are thought to be more susceptible to bias due to financial ties. They show that, when one controls for the quality of authors to eliminate selection bias, conflicts disclosures in reviews are associated with a reduction in citations.
- Second, they examine a sample of articles that have been screened by doctors based on quality, so are unlikely to be subject to selection bias, and track expert recommendations of those articles (as opposed to citations of those articles). They show that articles that disclose conflicts are less likely to be recommended by experts.
- Third, they examine how the citations an author receives for an old article change when that same author discloses a conflict in a different article. This analysis controls for selection by looking at the same author and article’s citations, before and after other researchers learn that the author actually has a conflict. They find that an author’s disclosure of a conflict in a new article reduces citations to that author’s older work.
This is a brief summary and readers are encouraged to read the full working paper to understand the details of their analysis.
Bottom line: This work finds evidence that disclosures negatively affect readers’ citation behavior, consistent with the notion that other researchers discount articles in which authors have disclosed conflicts.
-
While research has long examined the market for CEOs and executive mobility in public companies, the market for CEOs in private equity funded companies is less understood. This paper addresses that gap by studying the market for CEOs among larger US companies (enterprise value greater than $1 billion) purchased by private equity firms between 2010 and 2016. These are primarily leveraged buyout transactions, meaning that a significant amount of borrowed money was used in the acquisition (the authors use private equity and buyout interchangeably).

This research is more than an academic exercise, as the private equity industry has grown increasingly important in recent decades. From 2017 to 2021, for example, over 30,000 private equity deals (buyouts and add-on acquisitions) were completed with a total value exceeding $4 trillion, representing a market capitalization of more than 10% of the S&P 500. Further, these buyouts have greatly influenced the market for CEOs, including how they are selected and compensated. In addition, these buyouts have performed well: The average private equity fund formed between 2010 and 2016 outperformed the S&P 500 by a cumulative 22% and an annualized 5%.
The authors find the following:
- In large leveraged buyouts between 2010 and 2016, 71% of those companies hire new CEOs, and of those, more than 75% are external hires with 67% being complete outsiders. In contrast, among public companies, 72% of new CEOs are internal promotions.
- The outside CEOs hired during buyouts are, in order, raided executives who were previously not in a CEO position (representing more than half of the CEOs), unattached managers, followed by raided CEOs.
- Of the external hires, 67% were recently at a public company and 32% at an S&P 500 company, with nearly 50% having some previous experience at an S&P 500 company.
- Regarding compensation, the authors find that buyout CEOs earn appreciably more than CEOs of similarly sized public companies and only slightly less than CEOs of much larger S&P 500 companies, suggesting that externally hired CEOs perform well.
These findings lead the authors to consider the following implications for the market for CEOs and top executives:
- That top executives move from public companies to private equity funded companies at competitive compensation levels suggests that the broader market for CEOs is active and that, at least for private equity funded portfolio companies, firm-specific human capital is relatively unimportant.
- That the externally hired CEOs have previous experience in the same or related industries strongly suggests that industry-specific skills, rather than firm-specific skills, are important.
- The results for, and inferences from, publicly owned companies do not generalize to all companies.
Finally, the authors are left with a puzzle: Why are results so different for private equity funded companies and those companies in the S&P 500? Please see the working paper for a more detailed discussion, but possible answers suggest that the typical S&P 500 company has many talented executives from which to choose; that appointing outsider CEOs is value maximizing for private equity funded companies; and that, other things equal, the costs of getting a CEO candidate to move to a new firm, including moving costs and risk aversion costs, may bias firms toward hiring internal candidates.
-
Researchers for more than a century have theorized and studied the effects of propinquity in all manner of economic activity, from industry agglomeration (think of Detroit during its boom auto years or Silicon Valley and high-tech); to international trade (countries of a certain size/location tend to “gravitationally” attract each other); prices (firms’ pricing strategies are often based on location, not product differentiation), and even your own life (the simple insight that you are more likely to connect with people who work in offices or desks near yours, for example, or with those who share the same political views, holds large explanatory power for the development of friendship networks).

The list goes on, but a question remains. While research has revealed insights into the development of people-to-people networks, less is known about the allocation of people to organizations. Given that the efficient allocation of talent is of significant economic consequence, this gap in knowledge looms large. This work addresses that gap by asking whether propinquity is a factor within the matching of employee and employer in labor markets, and it does so by examining the Major League Baseball (MLB) Player Draft from 2000-2019. Specifically, the authors explore the draft picks across every MLB club of the nearly 30,000 players drafted (from a player pool of more than a million potential draftees).
This setting is ideal because MLB teams have increasingly employed data analytics when selecting players, which would seem to negate any propinquity bias among the clubs. In other words, in a labor market where players are highly scrutinized via objective data analysis, what difference could it possibly make whether a scout lived or worked near a certain player? Please see the full working paper for methodological details, but the authors’ extensive data allow them to explore whether players drafted in earlier rounds (who receive much more scrutiny) have less propinquity bias than those drafted in later rounds, where the scouting director has more latitude to drive the decision. The authors also examine the likely effects of changes in employment and residential location for scouting directors, and the impact of markets with two teams in one city, among other factors. They find the following:
- Propinquity is alive and well. In the authors’ base model, a player is 7.1% more likely to be drafted by a particular team if he lives 1,000km closer to the scouting director, controlling for skill. Further, the player is 4.9% more likely to be drafted by a particular team if he lives 1,000km closer to the city where that team plays.
- MLB clubs pay a real cost in terms of inferior talent acquired due to propinquity bias. For example, such draft picks appear in 25 fewer games relative to teams that do not exhibit propinquity bias. Measured another way, players drafted by teams under the influence of propinquity bias are 38% less likely to ever play in an MLB game relative to players drafted without propinquity bias. In addition, in a counterfactual exercise, the authors find that scouting directors do not learn from this experience and take their propinquity biases to their new teams.
- In an especially novel insight, the authors find that those players who benefit from propinquity bias also receive financial benefits: conditional on their draft order, their initial contracts are superior to counterfactual draft picks by 12%-25%.
- Finally, the effect is most pronounced in later draft rounds (after round 15 of over 40), where the scouting director has the greatest latitude. For instance, for rounds 16+, a player is 11.4% more likely to be drafted by a team if he lives 1,000km closer to the city where the team plays, and 11.8% more likely to be drafted by the team if he lives 1,000km closer to the scouting director, controlling for player quality.
Bottom line: Propinquity matters in person-to-organization networks. And, as the authors note, it may matter more than even the most optimistic propinquity theorists have suspected. This work examines propinquity’s effects on the MLB draft and offers key insights with likely applications to other labor markets. However, that is a matter of future research, and the authors are hopeful that their methodology and results provide a useful roadmap to explore this question in other settings.
-
Over the past two decades, China has taken steps to facilitate international participation in its capital markets, including Qualified Foreign Institutional Investors (QFII) and Renminbi QFII (RQFII), which allow licensed international institutional investors to directly invest in Chinese securities. Among all the accesses to Chinese capital markets, Stock Connect, which launched on November 17, 2014, and is the newest “opening-up” effort from Chinese policy makers, quickly became the dominant investment channel for foreign investors.
Stock Connect is distinctive in that it represents one of the greatest innovations in Chinese capital markets. The program achieves the goal of international financial integration (in certain stock/bond markets) with the rest of world, but without opening up China’s capital account. It does so by enabling investors from Hong Kong and overseas areas—but also qualified investors from Mainland China—to directly trade eligible shares listed on the other market via their local exchanges, without the need to adapt to the operational practices of the other market. More importantly, investors on each side can only use their funds to trade securities in the specified market(s) on the other side, without further access to the rest of the economy in the other market.
However, there is a dark side to this market. The authors show that Stock Connect creates regulatory loopholes for opportunistic mainland investors to arbitrage by “round-tripping.” More specifically, the authors present evidence that a group of “homemade” mainland investors—likely Chinese corporate insiders for the purpose of identity concealment—engage in cross-border trading via the connect program as if they were “foreign investors.”
Why would someone conceal their identity? Researchers have explored such motivations as tax evasion, tunneling, and market misleading, but this new work also examines round-tripping of insiders who choose to profit on their non-public information through the Stock Connect program. Round-tripping has gained prominence as the mainland and Hong Kong exchanges recently reached an agreement on the further expansion of eligible stocks under Stock Connect.
How does the Stock Connect program help conceal investors’ identities? In contrast to the mainland exchanges, which adopt a see-through surveillance scheme for trading and clearing, under Hong Kong’s jurisdiction there are financial intermediaries (brokers or custodians) who hold their clients’ securities under the names of intermediaries. During the first three years after the launch of the Stock Connect program in 2014, northbound trading (or the trading of China Connect Securities by Hong Kong and overseas investors through Stock Connect) adopted the scheme that is consistent with Hong Kong’s jurisdiction. Therefore, the Stock Connect program offers an opportunity for domestic traders in mainland markets to disguise themselves by trading eligible A-shares of connected firms indirectly.
Before describing the authors findings, it is important to note a key piece of legislation that the authors call a “game changer.” In a joint announcement made by the two regulators on both sides on August 24, 2018, the Stock Connect program established a system whereby northbound custodians are required to assign a unique identifier to their northbound clients. This allows the mainland regulator to identify the actual beneficial owner of each northbound trade and to deal with irregular mainland investors.
Please see the full working paper for a more detailed description of how Stock Connect has reshaped trading and dealing within and through mainland China; in brief, the authors employ a comprehensive dataset on northbound custodian holdings operated in the Hong Kong exchange to explore irregular trading activities and to address the question: Who are more likely to exploit the advantage of disguising themselves through the connect program? They find the following:
- Beginning with a study of return predictability of northbound flows from different origins in the Chinese A-share market, the authors find that although the trading activities of less prestigious foreign custodians and cross-operating mainland custodians were informative in the early days of the Stock Connect, their northbound flows have become uninformative about future stock since regulations were introduced to crack down on homemade foreign trading.
- In China, state-owned enterprises (SOEs) and non-SOEs differ in government scrutiny in ways that might make non-SOEs better accommodating insiders as homemade foreign investors. Meanwhile, centrally administrated SOEs have more levels of administration and hence lack information transparency, which also creates space for homemade foreign trading. Consistent with these hypotheses, the authors find that for both central-SOEs and non-SOEs, the return predictability of northbound flows from problematic custodians fell after the reform.
- Finally, concurrent trading activities of northbound investors from problematic custodians and mainland inside sellers become relatively infrequent after the regulatory reform.
The effort to crack down on cross-border regulatory arbitrage continues. As of July 25, 2022, northbound brokers are no longer allowed to set up trading accounts for mainland investors. This presumably leads to an elevated transaction cost and litigation risk for engaging in homemade foreign trading in China, and, as the authors suggest, may encourage the flow of genuine foreign investment into the emerging capital market and improve market efficiency.
-
Roughly one-third of women worldwide will experience physical or sexual violence by a partner at some point during their lives. In the United States, one-third of female murder victims are killed by intimate partners, and data from other countries reflect similar patterns.
Among its many negative effects, domestic abuse (DA) has far-reaching economic consequences: It adversely affects the employment, earnings, and welfare dependency of victims; it harms the health of babies in utero at the time of abuse takes place; and it lowers the educational performance of affected children and their peers.

How effective are policies or programs aimed at reducing domestic violence? This work addresses that question by focusing on two interventions initiated by the police: pressing criminal charges against the perpetrator, or providing protective services on the basis of a systematic risk assessment made at the scene of the incident. The authors estimate how these two different interventions affect reported violent recidivism in domestic abuse cases.
The setting for the authors’ study is England; specifically, the authors analyze data provided by Greater Manchester Police (GMP), which serves a population roughly the size of Chicago. The data include information on the date, time, and location of incidents, other characteristics of the incident, whether it was classified as a crime, whether the police pursued charges against the perpetrator, and if so, the referred charge. Criminal charges may arise from an investigation in response to a DA-related call for service. However, officers exercise discretion in determining whether a crime has occurred and, if so, whether it warrants prosecution. Officers may also arrest the perpetrator, but the perpetrator need not be arrested to be charged.
Please see the working paper for details, but the authors’ methodology statistically equates perpetrators who were charged with those who were not on the basis of several dozen characteristics of the incident, the participants, their domestic-abuse and criminal histories, the police officer who responded to the call, and their risk assessment scores. The authors stress that although many of these characteristics are highly predictive of treatment, they cannot equate charged vs. noncharged perpetrators based on unobservable characteristics. Methodological limitations aside, the authors find the following:
- Charges reduce the likelihood of violent recidivism by about 5 percentage points. Relative to the violent recidivism rate in the authors’ sample, which amounts to a reduction of almost 40 percent.
- In contrast, the authors found no evidence that alternatives to charges, like providing protective services for victims, reduced violent recidivism.
- Regarding the effects of criminal charges, the authors find that one group with a fairly serious criminal history had an ATT (the average effect of treatment on the treated, that is, the causal effect of the intervention on the probability of violent recidivism among the treated incidents) that was nearly 10 times larger than another group with a much less serious record. Importantly, this suggests that it may be possible to target investigative resources in ways that protect a greater number of victims from repeat domestic violence.
-
Administrative costs make up between 20 to 34% of health care expenditures, roughly 1-4% of GDP. Often characterized as wasteful, these costs are also spent on beneficial activities such as auditing claims for fraud, overbilling, or wasteful care, as well as enforcing compliance with managed care restrictions that limit access to costly providers, services, and drugs. Likewise, while increased efficiency could reduce administrative costs, their outright elimination would likely have deleterious effects.
This paper begins with the premise that bureaucracy has both costs and benefits. Managed care policies that restrict health care use trade off administrative burden for potential reductions in moral hazard1 and lower costs of insurance provision. The authors characterize this trade-off for prior authorization restrictions for prescription drugs, whereby patients can only receive insurance coverage for certain drugs (typically high-cost, on-patent drugs) if they receive explicit authorization; otherwise, they must pay the full cost out of pocket. Acquiring the necessary authorization requires the patient’s physician to fill out pre-specified paperwork to justify the drug’s prescription.

The goal of these policies is to restrict access to costly drugs to only those patients for whom those drugs provide the highest value. However, prior authorization comes with significant administrative costs: an average of 20.4 manpower hours per physician per week for physician practices in 2009; 34% of physicians report having at least one staff member who works exclusively on prior authorization requests.
That said, there are benefits to this process. Briefly, prior authorization allows providers to directly communicate information to insurers about the patient’s suitability for the drug, allowing insurers to target coverage denials to low-value use. Put another way, all of that paperwork signals the provider’s beliefs about a patient’s suitability for the drug. One imagines a doctor thinking: “I am not going through all of this hassle unless it is truly necessary.”
To examine this question and related issues, the authors study prior authorization empirically in Medicare Part D, the public drug insurance program for the elderly in the United States, focusing on the Low-Income Subsidy (LIS) program. The LIS program has two appealing features: First, LIS beneficiaries effectively pay nothing out of pocket for covered drugs, making prior authorization the primary feature of the insurance contract that shapes drug demand. Second, LIS beneficiaries frequently face default rules that assign them to a randomly chosen, and binding, plan if they do not make an active plan choice.
Please see the working paper for more details on the authors’ research design, but they begin by measuring the effect of prior authorization on drug utilization by comparing (within a given drug, region, and year) utilization for beneficiaries who are enrolled in plans that have authorization restrictions on that drug, against those assigned to plans that cover the drug without restriction, to find the following:
- Prior authorization restrictions reduce the use of focal drugs by 26.8%, with slightly larger relative effects among non-white and older patients, and smaller relative effects on drugs in high-benefit classes.
- Accounting for substitution to other medications (roughly half of patients do so), the authors estimate that the status quo use of prior authorization policies reduced total drug spending by 3.6%, or $96 per beneficiary-year, while only generating approximately $10 in paperwork costs.
- This reduction in spending is comprised of a $112 per beneficiary-year reduction in spending on restricted drugs and a $16 per beneficiary-year increase in spending on cheaper, unrestricted drugs.
Bottom line: Prior authorization restrictions are a powerful tool for reducing health care costs. Though they generate substantial administrative costs, these costs are small relative to the reductions in drug spending achieved by the restrictions, and those costs are also decreasing over time. Additionally, this work suggests that the first-order effect of prior authorization is not wasteful spending on bureaucratic processes; instead, the first-order effects are on drug utilization.
The authors close with a rich discussion on the welfare effects of prior authorization restrictions, as well as implications for other policy options, and readers would do well to visit this section. One case in point: a better understanding of administrative costs could shed light on the relative merits of health care systems in the US (where non-price rationing is done through managed care policies that generate administrative costs) vs. other OECD countries (where queue-based systems generate costs by forcing people to wait).
1 Moral hazard occurs when an economic agent (e.g., a person, household, business) has an incentive to increase its exposure to risk because it does not bear the full costs of that risk. For example, a bank with fully insured deposits, or even implied insurance by a government’s too-big-to-fail policy, may take on higher risk knowing that those risks will be covered.
-
How is it that among developed nations, the United States lags so far behind in health insurance coverage, with nearly 10 percent of its citizens uninsured? (See Figure 1). Evidence has shown that health insurance provides greater access to beneficial care with substantial health benefits. What would it take to ensure that all US citizens have at least a basic level of health insurance?
These and related questions motivate this new paper, which readers are encouraged to examine for an overview of the potential rationales for universal health insurance coverage, the evolution of US health insurance, comparisons to other systems, and a detailed discussion of the authors’ assessment of different policy options. This Finding highlights the authors’ dual approach to understanding the United States’ less-than-universal coverage and their assessment of how best to expand coverage.

1. The “Market Failures” Approach
To begin, a market failure refers to an instance where the distribution of goods and/or services via a private market is inefficient. Common examples are public goods, like streetlights, which are accessible to everyone and are nonrival (i.e., use by one person does not hinder use by another) – leading private markets to provide too little. Other examples include market concentration, where there is not enough competition to generate efficient prices; or asymmetric information, such as individuals knowing more about their health care needs than insurers.
Health markets abound in market failures, which has driven the predominant approach to insurance expansion. While this approach has yielded a large body of fruitful research elucidating the (many) problems affecting insurance markets, the authors argue that it has been less effective as a guide to universal coverage. This incremental approach via targeted policies to correct market failures results in a patchwork of policies, including expanding program eligibility, increasing subsidies, streamlining or nudging enrollment, finetuning risk adjustment, and penalizing uninsurance through individual and employer mandates. Indeed, many of the policies in the 2010 Patient Protection and Affordable Care Act are based on this approach.
Unfortunately, this incremental approach has sustained a fragmented US insurance system with many inherent limitations, including labor market “job lock” (in which workers remain in a job for fear of losing health insurance), regressive financing, costly complexity, and limited incentives for investing in population health. Finally, this approach fails to coherently define the social welfare goal of how much insurance (and health care access) should be available “universally,” nor the effect of insurance design on system-level investment in medical capacity and innovation.
2. The “Social Floor” Approach
An alternative approach, similar to that of other high-income countries, would automatically provide a basic level of insurance to everyone and then focus attention on key questions about the design of basic coverage and the availability of alternatives. This approach makes explicit many of the underlying goals and tradeoffs that are obscured in the incremental approach grounded in correcting market failures.
The devil, of course, is in the details, and the authors describe how economics can play a key role in framing the questions and understanding tradeoffs that arise under a social floor approach. In brief, they raise the following central issues:
- First, the actual social floor, or “basic bundle,” must be defined, and the framing must not be on whether health care is a right, but how much health care is a right, given real-world funding, capacity, and resource constraints. This means more than just defining coverable services. For example, almost all health services can be “medically necessary” for certain patients in certain situations but quite wasteful (with virtually no health benefit) in other situations. The generosity of basic coverage depends on which mechanisms are used to limit spending on covered services, such as global medical budgets, provider prices, capacity constraints, patient cost sharing, and utilization controls.
- This first issue raises the second: Who is in charge of administering and delivering basic coverage? Importantly, who decides how much to pay for which services and for which patients? A more coherent system than the current one, which delegates some decision-making to private insurers and some to various regulations, could yield benefits of simplicity and lower administrative costs.
- Finally, what about individuals with the resources to purchase additional coverage? Decisions about allowing such “top up” options have economic, ethical, and distributional implications. Complicating the issue of fairness, for example, is the possibility that a top-up system could increase incentives for innvoation in new treatments, with the benefits of such innovations redounding to all.
Of course, myriad political and logistical concerns would arise should the US move to a different framework, but those concerns need not be paralyzing. Other countries offer lessons and models. The United Kingdom, for instance, automatically covers all residents in its National Health Service, a public healthcare system with no out-of-pocket costs. The Netherlands and Switzerland provide universal coverage through a health insurance market in which people can choose among competing private plans offering basic coverage. Germany and Israel have systems of basic coverage through competing nonprofit plans, and Australia has a basic public medical system like the UK system, but with a much larger role for private hospitals and insurance. Finally, it is worth noting that the United States shares some similar components with these countries, so the idea of drawing on pieces of them is not farfetched.
Bottom line: Universal health insurance coverage is within reach for the United States if citizens and policymakers agree on what they mean by universal coverage and are willing to prioritize funding it. We could have a financially sustainable system in which all citizens have a basic level of health insurance and there are incentives for medical innovation that would benefit all. We just need to commit to a shared set of goals.
-
Despite aggregate productivity for the US economy having doubled over the past 50 years, the country’s construction sector has diverged considerably, trending downward throughout that period. And this is no slight decrease. Raw BEA data suggest that the value added per worker in the construction sector was about 40 percent lower in 2020 than in 1970 (see Figure 1).

How can a sector like construction, with average value-added of 4.3 percent of GDP between 1950 and 2020, experience such a precipitous decline in productivity relative to the rest of the economy? To answer this question, researchers have focused on issues relating to data measurement, hypothesizing that measurement errors largely explain this phenomenon. This new research updates some of those efforts and, importantly, extends them to investigate other hypotheses to find the following:
- Using measures of physical productivity in housing construction (i.e., number of houses or total square footage built per employee), the authors confirm that productivity is indeed falling or, at best, stagnant over multiple decades. Importantly, these facts are not explained by the incidence of price measurement problems.
- Instead of data error, the authors investigate two other possible explanations. First, they find that the construction sector’s ability to transform intermediate goods into finished products has deteriorated.
- And second, the authors describe the curious fact that producers located in more-productive areas do not grow at expected rates. Indeed, rather than construction inputs flowing to areas where they are more productive, the activity share of these areas either stagnates or even falls. The authors suggest that this problem with allocative efficiency may accentuate the aggregate productivity problem for the industry.
Bottom line: The productivity struggle within the construction sector is real, and not a result of measurement error. Given its place in the economy, this productivity decline has real effects: Had construction labor productivity grown over the last five decades at the (relatively modest) rate of 1 percent per year, annual aggregate labor productivity growth would have been roughly 0.18 percent higher, resulting in about 10 percent higher aggregate labor productivity (and, plausibly, income per capita) today.
-
The achievement gap in literacy between advantaged and disadvantaged children emerges before formal schooling begins and persists over the school years. Given evidence that advantaged parents spend more educational time with their kids, interventions have attempted to increase parental engagement by, for example, using text messages to “nudge” parents to read with their children. The relative low cost of these programs, especially relative to in-person parental training, has encouraged their use.
However, do such interventions work? Measurement gaps persist, owing in part to self-reported results. Also, while some programs include tablets to track parent reading time, these interventions do not reveal whether increased reading time leads to improved literacy skills. Finally, text messages in these interventions reflect a bundle of behavioral tools (reminders, goal setting, peer competition), leaving it unclear which behavioral tool drives the treatment effect.

To address these and other challenges, the authors implement an 11-month RCT with 379 low-income parents in Chicago to study both parent-child reading time and child literacy skills. Parents were randomized into four groups: 1) a control group, 2) a group that received a tablet containing a digital library, 3) a digital library tablet group with reminder texts, and 4) a digital library tablet group with goal-setting texts. This design allows the authors to distinguish between two different types of behavioral tools meant to address present bias, reminders and goal setting, as well as to measure the impact of using a digital tablet. The authors find the following:
- Relative to the group that received only the digital library tablet, adding goal-setting messages increased parent reading time by 50%, whereas adding reminder messages had no significant impact on parent reading time.
- Behavioral tools, delivered via text messages, increase reading time.
- However, despite leading to a significant increase in reading time, the goal setting messages had no significant impact on child literacy skills relative to the digital library tablet group. Further, the reminder messages led to a significant decrease in literacy skills compared to the tablet group, despite no significant difference in reading time.
What explains this last, counterintuitive finding? The authors hypothesize that a “nag factor” scales down task quality; that is, parents who are pestered to spend time reading with their kids may not perform optimally. This unintended consequence of nudging interventions relates to the literature on intrinsic and extrinsic motivation, where monetary incentives potentially backfire if they reduce intrinsic motivation. Nudge interventions are often described as having high benefit-cost ratios because even small benefits outweigh the nearly-zero cost of sending a text message. This work challenges that conventional wisdom by suggesting that nudges, indeed, could have a high cost.
- Finally, the authors find that deploying digital library tablets without nudging caused a significant increase in literacy skills relative to the control group, which highlights the role that technology could play in raising child skill, especially among low-income families.
This work not only challenges our current understanding of behavioral messaging and its effects, but it also suggests that future work using nudges to increase parental investments in early-childhood skills should consider the potential hidden costs or crowding-out effects of such efforts. Also, this work reveals the benefits of complementary home-based technology, like tablets, which are a relatively inexpensive intervention.
-
As the authors have described in previous work, the COVID-19 pandemic brought a shift in how people work, with more people expecting to work from home, and employers willing to meet that demand (“Working from Home Around the World”). This work revisits this issue to estimate the time savings that arise in a new work-from-home (WFH) world when people make fewer commutes.
The authors draw on the Global Survey of Working Arrangements, which samples full-time workers in 27 countries, aged 20-59, who finished primary school. In addition to basic questions on demographics and labor market outcomes, the survey asks about current and planned WFH levels, commute time, and more. The authors find the following:
- The average daily savings in commute time is 72 minutes when working from home.
- When the authors account for the incidence of WFH across workers—including those who never work remotely—WFH saved about two hours per week per worker in 2021 and 2022, and will likely save about one hour per week per worker post pandemic.
- For a full-time worker, these savings amount to 2.2 percent of a 46-hour workweek (40 paid hours plus six hours of commuting) which, in an aggregate of hundreds of millions of worldwide workers, amounts to significant savings.
- Regarding how workers apply those savings, the authors find that, on average, those who WFH devote 40 percent of their time savings to primary and secondary jobs, 34 percent to leisure, and 11 percent to caregiving activities.
In addition to time savings for workers related to less commuting, WFH home also means lighter loads on transport systems and, in particular, less congestion at peak travel times, with evidence also pointing to reduced energy consumption and pollution, as well as other benefits.
-
In the United States, federal and local governments spend almost $100 billion per year on spatially targeted development programs to revitalize economically distressed communities. Such urban renewal programs are not without controversy, especially regarding their impact on residents. Policymakers maintain that residents benefit from enhanced economic activity and improved amenities, while critics claim that such projects increase housing costs and force residents to move to less-desirable neighborhoods.

Who is right? The answer requires understanding both how individuals value neighborhoods and how local housing markets respond to policy. To examine this question, the authors develop a structural model of neighborhood demand and supply to quantify the welfare impacts of HOPE VI, a HUD program charged with eradicating severely distressed housing.1 The authors focus on Chicago, which previously had one of the largest US public housing systems and received substantial HOPE VI funding for building demolition. Between 1995 to 2010, the housing authority in Chicago demolished over 21,000 units of public housing.
The model assumes that households have preferences for the demographic and economic characteristics of residents, features of the housing stock, and the presence of public housing (please see the working paper for details). The authors also allow preferences to vary by households’ race/ethnicity (non-Hispanic White, Black, Hispanic, and other) and income level (below or above $20,000). For their analysis, the authors focus on how neighborhoods changed after the demolition of public housing in Chicago using US Census data to find the following:
- Between 2000 to 2010, when the vast majority of demolitions occurred, neighborhoods where a larger share of the housing stock was demolished saw substantial increases in the White population share alongside decreases in the share of residents that were Black or Hispanic.
- Areas with more demolition also saw growth in median household income, median rents, and house values.
- The share of newly constructed housing increased more in neighborhoods with more demolitions.
- When considering the longer-run horizon between 2000 to 2016, there were even larger changes in neighborhood characteristics, suggesting that demolitions had lasting effects.
- Overall, demolition of distressed public housing had disparate impacts and generated large welfare improvements for White households alongside welfare losses for low-income minority households.
What explains these findings? Broadly, white households especially value the removal of public housing and the decrease in minority population shares in neighborhoods where demolitions occur. White households also benefit more from increases in housing prices because they are more likely to be homeowners. Poor minority households are much less likely to own a home, so they are hurt by the increase in rents.

Finally, and importantly, this work offers a prescription for policymakers: even moderate increases in the scale of housing redevelopment in areas targeted by demolition can reverse the negative impacts of public housing demolition. High levels of redevelopment may even allow all racial and income groups to benefit. In the case of Chicago, this means that the welfare impacts of public housing demolitions could have been more positive if authorities had engaged in more intensive redevelopment efforts. This may also be true for other major U.S. cities such as Atlanta and Washington, DC, which also received substantial HOPE VI funding.
1 The HOPE VI Program of the US Department of Housing and Urban Development (HUD) was developed as a result of recommendations by the National Commission on Severely Distressed Public Housing, which was charged with proposing a National Action Plan to eradicate severely distressed public housing. The Commission recommended revitalization in three general areas: physical improvements, management improvements, and social and community services to address resident needs.
-
Scientific studies with human subjects often suffer from low and unequal participation rates across socioeconomic and demographic groups. Low participation rates mean there is a lot of “missing data”, leaving considerable room for unobserved differences between participants and non-participants to affect conventional estimates of population means. Inequality in participation rates can similarly cause bias and skew policy decisions away from achieving their intended goal. Survey estimates are used to allocate federal funds and other governmental resources in areas ranging from public health and education to housing, and to infrastructure. Hence, lower participation rates among low-income and minority groups may skew such decisions to their disadvantage.

Scientific studies that aim to survey a specific population exhibit non-participation for a number of reasons, including whether researchers are able to contact certain households (non-contact), or whether a contacted household believes that the costs of participating exceed the benefits (hesitancy). A challenge for researchers working to understand why it is difficult to recruit study participants is that participation data only reveal who does not participate, not why they don’t.
The distinction matters. In the case described in this new research, a lack of representation from Black, Hispanic, and low socioeconomic status households poses a risk to public health and a challenge for policymakers responding to COVID-19. If we don’t know why these households don’t participate, we cannot effectively encourage greater participation and, thus, improve health outcomes.
This paper addresses this knowledge gap by employing data from the Representative Community Survey Project’s (RECOVER) COVID-19 serological study, which experimentally varied financial incentives for participation. The study was conducted on Chicago households who were sent a package containing a self-administered blood sample collection kit, and were asked to return the sample by mail to a partner research lab to test for COVID-19 antibodies. Households in the sample were randomly assigned one of three levels of financial compensation: $0, $100, or $500.
The RECOVER study indeed saw that households with a high share of minorities and low-income households are underrepresented at lower incentives. For example, in the unincentivized arm, only 2% of households in high poverty neighborhoods participate, compared to 10% in low poverty areas. It is important to note that there are many other examples where underrepresentation matters. One prominent case beyond pandemic health policy concerns the 2020 US Census, where issues have been raised about under-counting Hispanic, Black, and Native American residents.¹
Please see the working paper for details, but broadly described, the authors develop a framework that uses experimentally induced variation in financial compensation for participation, along with a model of participation behavior, to separately identify and estimate the relative importance of non-contact and hesitancy for non-participation. They find the following:
- Financial compensation has a powerful effect on participation: the $100 incentive increases participation from 6% to 17%, and the $500 incentive increases it to 29%.
- The $100 incentive substantially increases participation among all groups, but widens differences in participation rates, while the $500 incentive increases participation further and, more importantly, it entirely closes the gap in participation.
- Both non-contact and hesitancy are key drivers of low participation.
- Underrepresentation occurs because poor and minority households are more hesitant and have higher perceived costs of participation, and not because they are harder to reach.
- For example, 61% of contacted households in majority minority neighborhoods would not participate for $100, compared to only 14% in majority White neighborhoods. Hesitancy explains 89% of the participation gap at $0, and 93% at $100.
Bottom line: This work offers valuable insights for policymakers about the quality of serological studies, where low participation rates can affect health outcomes, and about population surveys more generally. A better understanding of participation among racial and ethnic minorities, and households with lower incomes, offers the promise of better health and policy outcomes for all.
1 Wines, M. and M. Cramer (2022, March). 2020 Census Undercounted Hispanic, Black and Native American Residents. The New York Times.
-
In February 2022, when Western nations responded to Russia’s military buildup and subsequent invasion of Ukraine by imposing severe sanctions, private companies soon followed suit. More than 1,000 companies, employing over 1 million Russians, left Russia in the months following the invasion.
This relatively new phenomenon of private companies joining state sanctions is explained by different theories, including value-maximization aimed at protecting corporate reputation, and “woke-washing,” or making cheap business decisions to appear morally virtuous. Understanding why firms choose to act against states is important not only for those firms’ valuations but, importantly, for international political strategy as well. That is, if private sanctions become a part of modern warfare, then it behooves states to understand firms’ motivation.

This new research addresses this issue by studying the reaction of firms’ stakeholders. Do people support such action by private companies? Do they expect it? Are people willing to pay a personal cost to support such action? To examine these and related questions, the authors survey 3,000 US “hypothetical stakeholders” who are randomly allocated to three different treatments wherein they consider themselves an employee, a customer, or a shareholder of a firm that refuses to close its Russian operations. The authors find the following:
1. Stakeholders want the companies they patronize to take a position.
- Only 37% of the respondents (whether a customer, employee, or shareholder) think that leaving Russia is a pure business decision, best resolved by weighing the economic costs and benefits.
- Just 30% say that only the government should impose sanctions.
- For 61%, “doing business in Russia is like being an accomplice of the war” and a “company should sever its ties to Russia, whatever the consequences.”
2. A majority of stakeholders are willing to punish companies that refuse to halt their Russian operations, but their “willingness to punish” is strongly sensitive to the personal cost they pay.
- With no personal cost, 66% of the respondents are willing to punish non-exiting companies.
- If boycotting carries a cost of $100, 53% are still willing to boycott, and that number falls to 43% when the cost is $500.
- Sensitivity to cost suggests that participants trade off their moral obligation with their personal cost, which also suggests that answers to hypothetical questions are not pure virtue signaling.
3. To guide their analysis of factors (besides costs) that impact an individual’s decision to boycott a firm, the authors develop a simple framework with three components: a moral imperative, independent of consequences; a (randomized) dollar cost of acting; and the welfare impact of the moral action (partly randomized). Please see the working paper for more details, but this exercise reveals the following:
- The moral motive is worth about $250 for average participants, with a standard deviation of $2,000; this range is estimated from the fraction of participants who refuse to punish even if the cost is zero.
- Participants who claim willingness to punish “even if no one else does it” have a moral motive on average worth $1,000, instead of $250 for the sample average. A similar impact is observed for participants who answer that “the firm should exit Russia, no matter what.”
- Being told that their “punishing action” will negatively affect the company has little effect on respondents’ answers.
4. Finally, the authors find that the willingness to impose sanctions is highly related to moral values.
- Participants with a high score on compassion and authority, and a low score on purity and loyalty, are much more willing to punish the “immoral” firm.
- Older generations are much more willing to punish the firm for not leaving Russia than younger ones, which stands in stark contrast with the commonly held view that the younger generation is politically more sensitive (a difference possibly explained by older respondents’ experience of the Cold War with Russia).
- Liberals are more willing to impose sanctions than conservatives, but the additional explanatory power of political leanings is small.
Bottom line: The assertion that firms should focus only on profit maximization is challenged by this paper’s findings, which reveal that a majority of Americans prefer that private firms engage in sanctions to effect public change, as revealed in the case of Russian sanctions meant to end the war. Further, this work offers a methodology to predict which firms will impose private sanctions and in what situations.
-
When researchers measure or track national economies, they do so by relying on a system of accounts that records how production is distributed among consumers, businesses, governments, and foreign nations. Pioneered nearly a century ago, these measures are formalized in the System of National Accounts (SNA), which incorporates a set of internationally agreed concepts, definitions, classifications, and accounting rules.
While useful for tracking broad measures like national consumption, income, and output, the SNA offers no system to comprehensively document bilateral consumption and income flows between disaggregated consumer and producer groups, only between producer groups. Put another way, the SNA contains little data measuring flows between smaller subgroups of the economy, like which consumers purchase goods from which producers, which producers pay income to which consumers, and how consumers and producers transact with the government and the rest of the world.
No mere technocratic issue, this absence of comprehensive disaggregated economic accounts has direct and important implications for policymakers. With an incomplete understanding of how shocks propagate across the economy, and of how they heterogeneously affect aggregate and distributional outcomes, policymakers are limited in their ability to set focused policies. Instead, policymakers must rely on broader policies that may miss the mark or otherwise result in unintended consequences.
This new research addresses this gap. The authors develop “disaggregated economic accounts” for Denmark using various transactional and governmental microdata, including region- by-industry cells of consumers and producers, capturing rich heterogeneity in flows and shock incidence across regions and industries (see disaggregatedaccounts.com), to present facts on the circular flow of money across cells, including the following:
- Distance has a strong effect on consumer spending, labor compensation, and intermediates trade. Distance matters most for regular, in-person consumer spending (e.g., fuel, groceries) and less for travel-related spending (e.g., hotels) and remote services (e.g., insurance and telecommunication).
- Consumer spending flows toward cities—the population size of a consumer cell’s home region is almost always lower than the average size of regions receiving its spending. Similarly, net spending on intermediate goods by producers flows toward urban regions, which is mostly driven by the prevalence of service producers in cities.
- Spending abroad accounts for 12% of city consumers’ spending and 8% of rural consumers’ spending.
- Net exports make up a larger share of rural producers’ output (mostly manufacturers), while domestic sales are more important for city producers (mostly services).
- Net transfers by the government to consumers (transfers minus taxes) are larger in rural regions, but the government employs and purchases more in cities. On net, the government transfers resources into cities.

The authors also develop a model that allows them to study how shocks propagate across region-industry cells, improving on empirical analysis that typically cannot disentangle all general equilibrium1 propagation channels. Their model reveals that the structure of disaggregated economic accounts shapes the distributional and aggregate consequences of economic shocks in the following ways:
- The effects of fiscal policy on aggregate welfare are very heterogeneous depending on which cells are targeted. Changes tend to be amplified more for consumer cells whose spending remains in the country for longer, which concretely means cells in rural regions, per the patterns described above.
- A uniform reduction in export tariffs has stronger direct incidence on rural consumers, but nonetheless improves the welfare of urban consumers by more once indirect spillovers are included.
The authors use their model to predict the effects of targeted fiscal policy on aggregate welfare. Specifically, for each consumer cell, they compute the welfare change experienced by the aggregate economy if that consumer cell receives a transfer from the government, and find the following:
- The aggregate welfare multiplier is very heterogeneous across consumer cells, varying with a cell’s position in the disaggregated circular flow: the longer a transfer to a cell circulates in the domestic economy before leaving the country, the larger the cell’s aggregate welfare multiplier. Intuitively, a transfer that circulates longer domestically generates more income for Danish consumers, raising Danish welfare along the way.
- In line with the trade patterns described above, rural regions are associated with longer domestic circulation and therefore greater welfare multipliers.
In a second set of applications of their model, the authors consider revisit the gains from trade through the lens of their disaggregated economic accounts. Specifically, they study how a uniform reduction in export tariffs affects the distribution of welfare across consumer cells, and find the following:
Since rural producers export more, the direct incidence of tariff reductions falls mainly on rural producers and consumers. They benefit from higher export revenue and, as a result, higher incomes.
However, the general equilibrium benefits accrue mostly to urban consumers, at odds with the direct incidence. The discrepancy between direct and general equilibrium incidence is driven by the structure of disaggregated economic accounts. The urban bias of consumer spending and domestic trade implies that urban consumers indirectly receive much of the additional export revenue. Moreover, the higher foreign spending of urban consumers implies that urban consumers are less affected by the rise in domestic prices due to the additional export revenue.
Bottom line: This analysis of disaggregated economic accounts substantially enriches our understanding of shock propagation and may aid in the design of policy interventions. While much of the raw data required to construct disaggregated economic accounts are already collected in many advanced economies, further data processing is required. However, the social benefits of constructing disaggregated economic accounts may outweigh the costs.
1 General equilibrium analysis is concerned with the simultaneous determination of prices and quantities in multiple inter-connected markets, as opposed to partial equilibrium analysis, which considers a single sector or market.
-
Given news reporting in recent years, many readers are likely familiar with research which finds that, conditional on an encounter, police officers are more likely to enforce a law, conduct a search, or use force when a civilian belongs to a racial minority group. In other words, once they are stopped, minorities are more likely to face some police action. However, what research has yet to show is whether minorities are stopped more in the first place.
This new paper addresses the issue of minority status and the likelihood of police encounters by reviewing driving data from Lyft records in Florida from August 2017 to August 2020, totaling over 40 billion observations. These data allow the authors to explore whether minority drivers, because they are minorities, are more likely to be stopped and to be issued a citation. To examine this question, the authors focus on citations for speeding.

Please see the full working paper for more details on the authors’ methodology, but it is important to note that to operate on the Lyft platform, drivers must use a smartphone that communicates their location in real time. Combining this information with administrative data on driver race and police stops for speeding, allows the authors to directly measure the effect that driver race has on the probability of being stopped for speeding. The authors find the following:
- Minority drivers are 24 to 33 percent more likely to receive a speeding ticket for traveling the same speed as white drivers.
- These differences amount to minority drivers paying 23 to 34 percent more in fines for the same level of speeding as white drivers. Importantly, both of these differences are highly statistically significant.
- Further, there is no evidence to support the notion that police punish minority drivers more harshly because of differences in re-offense or accident rates.
For policymakers and business leaders, these findings offer salient insights. For example, relative to police officers, automated technologies such as speeding cameras could help reduce selective enforcement of traffic regulations. And for car insurance, where rates typically increase when drivers are cited for speeding, this research indicates that such citations are not blind to driver race. Taken together, accounting for race in the relationship between citations and insurance rates could help diminish the impact of racial differences in the enforcement of speeding regulations.
Finally, a note about research: While these findings are not guaranteed to generalize beyond drivers on Lyft’s platform or Florida, the authors’ research design allows for such an evaluation. In addition, this research illustrates how an application of high-frequency location data can apply to other important questions, like geographic mobility and racial differences in voting wait time.
Bottom line: The authors’ novel research design advances our scientific understanding of race effects in policing, and provides further justification for policy interventions to ameliorate these effects.
-
Do households pay attention to inflation when making investment decisions? That question has risen in prominence as inflation has recently soared to heights not seen in decades. Central bankers care about the answer because managing inflation expectations is key to effective monetary policymaking. Are households’ expectations aligned with policy? If not, will households’ actions generate higher future inflation? Further, and importantly, how strongly and how fast do consumers adjust their choices in response to changing inflation expectations?
To examine these and related questions, the authors seek alternatives to the conventional, and often unreliable, technique of survey-taking to study household investment decisions, focusing on aggregate flows into funds that hold inflation-protected Treasury securities (TIPS), considered attractive assets for risk-averse sectors. The authors’ working hypothesis is that a rise in realized inflation, inflation expectations, or inflation uncertainty could make inflation risks more salient to retail investors, leading to an increase in households’ aggregate demand for TIPS relative to other market participants and, hence, a positive net flow into TIPS.

Please see the working paper for details on methodology but, in part and in brief, the authors study retail flows into exchange-traded funds (ETF), supplemented with additional tests using open-ended mutual fund (MF) flow data (of which little is currently known), along with survey-based expectations from the Michigan Survey of Consumers and the Federal Reserve Bank of New York, to find the following:
- Broadly, households participating in financial markets pay attention to inflation news when making investment decisions, even in an environment of mostly low and stable inflation.
- When market-based long-horizon inflation expectations rise, aggregate household inflows into inflation-protected ETF increase, while nominal Treasury ETF experience outflows.
- Relatedly, potentially inflation-relevant events like the taper tantrum in 2013 and the 2016 presidential election are also associated with substantial retail TIPS fund inflows.1
- Regarding such inflation-related events, and somewhat surprisingly, changes in market-based measures of inflation expectations extracted from inflation swap rates are likely the best proxy for whether those events induce households to change their allocation to inflation-protected investments. (Inflation swap rates are an inflation protection strategy whereby investors transfer inflation risk to a counterparty in exchange for a fixed payment.)
- Household survey-based measures have little incremental explanatory power for retail TIPS fund flows over and above market-based measures.
- Changes in market-based inflation expectations, especially the first movements of upward inflation, dominate changes in inflation uncertainty in explaining retail TIPS fund inflows.
Bottom line: For policymakers interested in understanding inflation concerns of households, this research suggests that market-based expectation measures should not be dismissed. Indeed, such expectations are closely linked to households’ investment decisions, and movements in market-based expectations provide a good summary of the inflation news that reaches households. Further, and pertinent to current events, households’ investing behavior may provide additional early cues on whether the central bank is losing credibility, and whether inflation expectations are becoming unanchored.
1 On May 22, 2013, the Federal Reserve announced it would start tapering its asset purchases at some future date, igniting huge retail outflows from TIPS ETFs in the following weeks. These outflows coincide with the “Taper Tantrum” in bond markets that saw a sharp rise in Treasury bond yields and that was widely covered in the media. Similarly, there was strong net retail buying of TIPS ETFs following the election of Donald Trump as US president in November 2016.
-
While religions shape cultural norms and values, motivate social group organization, and define the contours of political and economic power, we know little about what influences people’s adherence to religious practices. Religious adherence has been hard to study in part because it is hard to measure. Most studies of religious observance rely on surveys, which are undependable owing to infrequent and sparse coverage over space (especially in conflict-prone regions), and because they use stated rather than revealed preferences. In other words, surveys measure what select people say, and not what they do.
In this paper, the authors offer a new approach to measuring religious adherence that they apply to the study of religiosity in Afghanistan. Their approach is based on a simple insight: A core tenet of Islam is to pray five times daily at specific times; therefore, the authors posit that the amount of non-prayer activity observed during the prescribed prayer window provides an indication of religious adherence.

The paper contains both a methodological and applied section, which are briefly described in this Economic Finding (please see the full working paper for more details). In the methodological section, the authors employ anonymized mobile phone data from one of Afghanistan’s largest mobile phone operators to measure religious adherence based on the volume of call drops during the evening Maghrib (sunset) prayer window. Talking to others, including on the phone, is widely considered to invalidate prayer, and the Maghrib prayer window is well-suited to this task because it is short and well-defined, and because it occurs during a time when people are awake and otherwise active. Based on data from nearly 10 million unique phone users and 22 billion phone calls from 2013-2020, the authors find the following:
- There is a substantial decrease in call volume immediately following the start of the Maghrib window. Across Afghanistan, on average, call volumes drop by roughly 25% about 15 minutes into the Maghrib prayer window, which the authors coin as the “Maghrib dip.” (See Figure 1)
- The Maghrib dip tracks sunset: When sunset (and hence the start of the Maghrib prayer time) occurs later in the day, the Maghrib dip also occurs later in the day. (See Figure 2)
The authors validate this measure of religious adherence by analyzing survey and geographic connections, to find the following:
- There is a strong correlation between stated religious adherence and a correspondent Maghrib dip; a one standard deviation increase in the survey religiosity index is associated with a 44% increase in the Maghrib dip.
- Geographic variation in the Maghrib dip across Afghanistan correlates with existing data related to religious norms. For example, the Maghrib dip is largest in areas that are contested or controlled by the Taliban, which strictly—and at times violently—enforced religious norms.

Having developed a new methodology to measure religious adherence, the authors then apply this technique to study the effects of economic adversity on religious adherence. On the one hand, adverse economic shocks may lower religious adherence by testing people’s faith or by reducing time available to participate in religious activity. On the other hand, economic shocks may increase religious adherence by, for example, lowering the opportunity cost of participating in religious activities, spurring individuals to seek social insurance, or by helping them cope with adversity. The authors study the relationship between economic adversity and religion by examining the effect of quasi-random climate shocks on religious adherence (shocks that greatly impact Afghanistan’s agricultural sector). They find the following:
- Adverse climate conditions significantly increase religious adherence; for example, a major drought increases religious adherence by 24%, as much as the change that occurs when the Taliban contest or take control of a district.
- Climate shocks influence religiosity through their economic impact. In particular, the effects of climate on adherence are concentrated in areas that are most sensitive to droughts, such as pastoral areas and cropland areas that lack access to irrigation.
Climate shocks exert the strongest effects on religious adherence during the growing and post-harvest seasons, and have no statistically significant effect during the harvest season itself. Thus increases in religious adherence stemming from adverse climate conditions do not reflect the opportunity cost of time — since the agricultural workload, (and hence the opportunity cost of time) , reaches a peak during the harvest season. Rather these patterns suggest that people turn to religion to help them cope with the expectation or experience of bad economic downturns.
Bottom line: The authors’ simple—yet powerful—insight that aggregate patterns of technology use (and dis-use) can provide a new, quantitative perspective on religious adherence over time and space in Afghanistan is applicable to other religious environments around the world. Indeed, the authors’ approach is likely relevant to a wide range of contexts where anonymized digital transaction logs are available.
-
Carbon taxes, which are levied on the carbon emissions required to produce goods and services, are considered an optimal solution to combat climate change because they help bridge the gap between the private and social costs of carbon. Is one company or industry producing an inordinate amount of carbon? Tax them at a rate to bring their carbon emissions—and the aggregate emissions of the country—in line with global goals.
And therein lies the rub. How do you get countries around the world to agree on a global carbon tax plan? How do you prevent companies from moving to countries with no carbon tax? And, if you cannot get all countries (or at least the biggest polluters) to agree on a carbon tax, does it even make sense for countries to go it alone?

According to conventional wisdom, the answer to that last question is No. However, this new research argues that this reasoning is incomplete and misleading because it ignores how unilateral carbon taxes (or those issued by one country or group of countries) interact with the forces that shape the economic geography of the world. The authors show that the spatial response (or that within and among countries) to a unilateral carbon tax can lead to a local expansion of the region introducing the tax, and to global welfare gains.
Before describing the authors’ findings, a very brief note about their model (please see the working paper for more details), which features a realistic world economy divided into more than 17,000 locations. In this world, a carbon tax that mitigates global warming also affects the geography of absolute and comparative advantage because sectors differ in their energy intensity (non-agriculture emits more carbon than agriculture). Also, people in this world have the possibility to move. Migration and trade patterns adjust to carbon tax rebates, which benefits locations specialized in sectors with a higher effective carbon tax.
The authors’ quantitative policy analysis focuses mainly on the European Union (EU), which has plans for a region-wide carbon tax, though they show very similar results for a carbon tax introduced by the US. The authors’ analysis offers the following predictions:
- A hypothetical uniform carbon tax of 40 US$ per ton of CO2 introduced by the EU and rebated locally can increase the size of the EU economy by further concentrating economic activity in its high-productivity non-agricultural core, and by attracting more immigrants to Europe.
- This, in turn, leads to a more efficient global distribution of population, so that world welfare improves.
What explains this result? The answer lies in how a carbon tax acts to shift economic activity across space. This may seem counterintuitive. Readers might expect an EU carbon tax to weaken Europe’s comparative advantage in non-agriculture. Indeed, the higher energy intensity of non-agriculture implies costs are pushed up more by a carbon tax, leading to a relative drop in nonagricultural output. If carbon tax revenue were lost, this would be the case: The EU would shrink, and global welfare would decline.
However, when carbon tax revenue is locally rebated, the results are reversed. The higher relative tax burden in non-agriculture is only partly passed on to wages, so once local rebating is added, regions specializing in non-agriculture experience a relative gain in income. The authors formally prove how the introduction of a carbon tax in a single location can generate a positive income effect on its economy. Importantly, this tax must be relatively moderate; if too high, these benefits are lost due to standard distortionary effects. In the case of the EU, this income effect generates migration from agricultural to non-agricultural regions, causing non-agricultural output to increase relative to agricultural output. This effect is further amplified because businesses tend to cluster close to each other and in high population areas, a phenomenon known as agglomeration forces.
A sort of positive feedback loop develops. As Europe’s non-agricultural core grows, the EU attracts more immigrants, and its economy becomes larger. And although real income per capita in the EU drops, the reallocation of population and economic activity from less productive areas of the world improves global efficiency and welfare. This suggests that in the absence of a carbon tax there is too little geographic concentration in the EU core and there are too few people in Europe. As such, an EU carbon tax with local rebating acts as a place-based policy that subsidizes Europe’s non-agricultural core and attracts more people to move to the European Union. This point bears stressing:
- Not only does a unilateral EU carbon tax lower global carbon emission, thus mitigating planet warming, it also increases Europe’s weight in the world economy while improving global welfare and efficiency.
If a unilateral carbon tax is introduced by the United States (US), instead of by the EU, the global welfare gains are similar.
Bottom Line: For policymakers, this research reveals that a modest unilateral carbon tax can be globally welfare-improving while also expanding a local economy. Local rebating subsidizes highly productive non-agricultural regions and incentivizes people to move to these regions in the EU or the US. With more people living in the developed world, global efficiency and global welfare improve, while planet warming ebbs.
-
For many workers and their managers, the end of the year brings an often-dreaded ritual—not the office holiday party—but rather the annual performance review. News stories, articles, and books abound on the benefit/cost of performance reviews, on how to best conduct them, or on whether to abolish them entirely. An article in the Harvard Business Review begins with this blunt assessment: “People hate performance reviews. They really do.”1
Even so, performance measures are not without value. The problem for employers is that objective measures are difficult to obtain, leading them to rely on evaluators’ subjective evaluations. This challenge is prevalent within the public sector, due to the inherent problems of measuring individual achievements and the multiplicity of tasks for most civil service jobs. Further, subjective evaluations can introduce what researchers describe as “influence activities,” such as putting extra effort into tasks that are more visible to the evaluator, or “buttering up” the evaluator with personal favors. Both of these activities may benefit the worker, but they are not necessarily optimal for the organization.

Researchers have long investigated the formation and consequences of influence activities, but largely on a theoretical basis. This new work, based on large-scale field experiments in two Chinese provinces, overcomes long-standing empirical challenges to provide evidence on the existence and consequences of influence activities in the workplace. The authors focus on China’s “3+1 Supports” program, a large national “human capital reallocation” initiative that hires more than 30,000 college graduates annually to work as entry-level state employees in rural townships on two-year contracts, whom the authors label College Graduate Civil Servants (CGCSs).
Before describing the authors’ methodology and findings, let us first briefly review China’s dual-leadership governance system, wherein every government organization/subsidiary has two leaders: a “party leader” (i.e., party secretaries at various levels) and an “administrative leader” (i.e., the head in a village, the mayor in a city). Likewise, every CGCS reports to two supervisors who both assign her job tasks and provide performance feedback, which determines whether the CGCS will be awarded a highly prized permanent contract upon completing her two-year term. This situation is ripe for influence activities, and rich anecdotal evidence attests to such behavior.
To empirically examine the existence of influence activities, the authors collaborated with two provincial governments in China and randomized two performance evaluation schemes among 3,785 CGCSs working in 788 townships. In both schemes, the authors randomly selected one of the two supervisors to be the evaluator. The only difference is that, in the “revealed” scheme, the authors announced the identity of the evaluator to the CGCS at the beginning of the evaluation cycle, meaning that the CGCS knew whose opinion would influence her promotion. In the “masked” scheme, the identity of the evaluator was kept secret until the end of the evaluation cycle, so that the CGCS perceived each supervisor as having a 50% chance of influencing her promotion. Finally, the authors did not inform the supervisors about who was the chosen evaluator in either scheme.
The authors find the following:
- In the revealed scheme, the evaluating supervisor gave significantly more positive assessments of CGCS performance than his non-evaluating counterpart, which is consistent with a scenario where the agent engages in evaluator-specific influence activities—either productive or non-productive—to improve evaluation outcomes.
- There is no such asymmetry in supervisor assessments in the masked scheme: Masking the evaluator’s identity incentivizes the CGCSs to reallocate their efforts from evaluator-specific influence activities to productive tasks that are valued by both supervisors, which can significantly improve CGCS work achievements.
- Further, under the revealed scheme, the CGCS devotes more efforts to the job tasks assigned by her evaluator and deems the assignments from the evaluator as more important; in addition, her work performance improves more in areas that are valued more highly by the evaluator. Further analysis suggests that these patterns are driven by the behavior of the CGCS, rather than the behavior of the evaluator.
The authors interpret these findings as indicating the existence of productive influence activities in this environment. As for nonproductive influence activities, their empirical evidence is suggestive of such behaviors, but since they cannot directly observe and measure nonproductive influence activities, they do not take a strong stance on their prevalence.
Bottom line: This work not only sheds light on China’s dual-leadership structure and the performance of more than 50 million state employees, but also offers insights into organizations around the world that have adopted and institutionalized various dual-leadership arrangements, such as pairing a chief executive officer (CEO) with a chief operating officer (COO) in private firms, and “Office of the President” arrangements in public institutions. In all these cases, introducing uncertainty to subjective (and even objective) evaluation schemes could potentially lead to performance improvements.
-
Large firms in the United States frequently grow by expanding into new regions, such that local labor markets are increasingly dominated by a small number of large firms that operate in many areas (service-related chains, for example).1 Given their many locations across heterogeneous labor markets, how do these national firms set wages? This is more than just an academic question, as the answer concerns such issues as wage inequality, the growth of labor market power, and the response of the economy to local shocks. However, little is known about national firms’ influence on these phenomena. This work addresses that gap by employing a novel combination of datasets and a theoretical framework to test empirical findings.

The authors’ primary dataset contains online job vacancies provided by Burning Glass Technologies, including roughly 70% of US vacancies, either online or offline, between 2010 and 2019, of which the authors focus on the 5% that provides posted point wages for detailed occupations across establishments within a firm. These data contain detailed job level information that allow the authors to control for changes in job composition across regions, and they include hourly wages for non-salaried workers and annual wages for salaried workers, which allows them to distinguish between wages and earnings. The authors supplement these data with survey data from human resource professionals, with self-reported salary data, and with reports from firms applying for foreign worker visas, to reveal the following facts:
- There is a large amount of wage compression within firms across space; 40-50% of postings for the same job in the same firm—but in different locations—have exactly the same wage.
- Identical wage setting is a choice made by firms for each occupation—for a given occupation, some firms set identical wages across all their locations, while the remaining firms set different wages across most of their locations.
- Within firms, nominal wages are relatively insensitive to local prices.
- Firms setting identical wages pay a wage premium.
The authors compare wage growth in the same job across different establishments over time, and they study the effect of a local shock to wages to provide evidence that the identical wages described above are due to national wage setting. They also survey firms to discovers a range of reasons for why they choose to set wages nationally, including hiring on a national market, simplifying management, and adhering to within-firm fairness norms. Of note, government policies such as minimum wages do not appear to drive national wage setting. These reasons point to a mix of firm and occupation specific factors that matter more for higher wage workers, and which suggest that nominal pay comparisons matter to workers.
The authors also develop a model-based exercise to measure the profits at stake from setting wages nationally. Please see the working paper for details, but this theoretical exercise reveals that in the absence of national wage setting, wages for national wage setters would vary across establishments by a median of 6.1%, and profits would be 3 to 5% higher. If firms set wages nationally to raise productivity, the authors’ estimate bounds the increase in profits that is needed to make national wage setting optimal.
Finally, this work has three key implications with policy relevance. National wage setting:
- Reduces aggregate nominal wage inequality by roughly 5% by compressing nominal wages across space.
- Raises employment in low-wage areas. Likewise, national wage setters seem to reduce aggregate wage and earnings inequality without dis-employment effects, through raising wages in low-wage regions.
- Raises regional nominal wage rigidity, meaning that regional wages (absent inflation) are more resistant to change.
-
Almost 2 million American servicemembers deployed to Iraq or Afghanistan following September 11, 2001. Over the following years, the age and sex adjusted suicide rate of veterans rose nearly twice as fast as non-veterans, and real annual Veterans Affairs Disability Compensation (VADC) payments per living veteran rose from $900 to $4,700, reaching total annual expenditures of nearly $100B by 2021, a rate 10 times larger per eligible beneficiary than Social Security Disability Insurance.

What explains the decline in veteran well-being and rise in VADC? Many point to the long-run behavioral and health consequences of combat deployments. However, assessing the causal role of warfighting is challenging because many other factors have changed over this period, such as the Army permitting more soldiers with low Armed Forces Qualification Test (AFQT) scores or prior felony convictions to enlist in response to recruiting shortfalls. In addition, changes in policy have also made it easier for veterans to qualify for VADC.
To examine these issues, the authors construct a unique dataset that combines numerous military and non-military administrative data sources. These data allow the authors to investigate the causal effects of deployment on VADC and noncombat deaths, including deaths of despair and suicides, and other key measures of veteran well-being over long time horizons.
Despite their rich dataset, identifying the causal effect of combat deployments remains challenging because soldiers are not deployed at random. For example, unit commanders may prefer to bring their best soldiers to war and leave the rest behind, while soldiers with extenuating family or other circumstances may also avoid deployment. To overcome these challenges, the authors employ an empirical strategy that leverages the quasi-random assignment of newly recruited soldiers to units. This allows them to compare soldiers assigned “as-good-as randomly” to units that vary in their propensity to deploy but that are otherwise similar, approximating a true randomized experiment in which some soldiers are sent to war, but others are not.
The authors’ findings include the following:
- Combat deployments substantially increase VADC payments. An average 10-month deployment increases any VADC receipt by 9.4pp and annual VADC compensation by $2,602 per person eight years after enlistment. Some of this increase is explained by warfighting. Other channels also play a role, however, including physical overuse and psychological trauma from deployment, as well as the potential for the deployment experience to relax VADC eligibility requirements.
- Combat deployments increase the risk of death and injury. A 10-month deployment increase all-cause mortality by 0.53p.p within eight years of enlistment, but almost all of this is a result of deaths directly attributable to combat. The estimated effect on overall noncombat deaths within eight years of enlistment is 0.05pp and not statistically distinguishable from zero. For deaths of despair, which primarily comprise suicide and drug or alcohol-related deaths, the estimated effect is 0.002pp.
To better understand whether deployment has important adverse effects beyond increasing average disability and mortality due to combat, the authors also conduct additional analyses and find the following:
- Deployments do not cause soldiers to be removed from service for misconduct or to be incarcerated. Deployments do not worsen credit scores or educational outcomes.
- Soldiers assigned to brigades with higher casualty rates are no more likely to die outside of combat. Additionally, soldiers exposed to more violence on deployments of the same duration do not have worse outcomes on non-combat mortality, misconduct, incarceration, credit, or educational attainment.
The authors conclude by revisiting the striking trends in veterans’ outcomes that have been the focus of much public attention. They find that while deployment explains a large portion of the early 2000s increase in VADC receipt, more recently VADC and deployment have decoupled. The most recent cohorts of soldiers have some of the highest levels of VADC and the lowest deployment risk, suggesting that changes in overall VADC generosity and eligibility criteria may be responsible for the most recent surge. Deployment also does not explain changes in noncombat deaths, which are more closely connected to changes in the observable characteristics of whom the Army allowed to serve.
Bottom line for policymakers: This work offers a cautionary note against laying too much blame for veterans’ outcomes on combat deployment itself. To better support veterans of both past and future wars, it is important to understand a broad set of determinants of veterans’ outcomes, as well as the drivers of selection into service.
-
What is the impact of uncertainty on investment? Without understanding how uncertainty is perceived by managers, this question is difficult to answer. The literature often uses proxies like stock-market volatility, sales and investment volatility, implied-volatility, earnings calls, SEC filings, newspapers, or various macro measures of uncertainty. However, none of these measures provides a direct measure of managers’ actual subjective uncertainty.

This new paper addresses that gap by describing the first results of an ambitious survey of business expectations conducted in partnership with the US Census Bureau as part of the Management and Organizational Practices Survey (MOPS). MOPS is the first large-scale survey of management practices in the United States, covering more than 30,000 plants across more than 10,000 firms. Thus far, it has been conducted in two waves, for reference periods 2010 and 2015, with results from a third wave for reference year 2021 scheduled for publication in 2023. The sample size and high survey response rate, the use of the establishment within the firm as the response unit, the ability to link to other Census Bureau data, and comprehensive coverage of manufacturing industries make the MOPS dataset unique.
As part of the 2015 MOPS, the authors asked questions regarding plant-level expectations of own current-year and future outcomes for shipments (sales). The survey questions elicit point estimates for current-year (2016) outcomes and five-point probability distributions over 2017 (next-year) outcomes, yielding a much richer and more detailed dataset on business-level expectations and subjective uncertainty than previous work, and for a much larger sample. Please see the working paper for more details, but through an analysis of forecasts and outcomes, the authors determined that managers provided well-considered responses. The authors find three stylized facts (or broad tendencies that summarize the data):
- Investment is strongly and robustly negatively associated with higher uncertainty, with a two standard deviation increase in uncertainty associated with about 6% reduction in investment.
- Uncertainty is also negatively related to employment growth and overall shipments growth, which highlights the damaging impact of uncertainty on firm growth.
- Flexible inputs like rental capital and temporary workers show a positive relationship to uncertainty, showing how firms switch from less to more flexible factors at higher levels of uncertainty.
-
If you have strong religious and/or political beliefs, are you open to facts that go against your views? And will you change your mind? Numerous observational studies suggest that the answer is “No” to both questions. Further, the theory of motivated cognition says that you will actively distort, neglect, or deny information that contradicts your fundamental values, and other people will do the same. Importantly, this means that people with disparate fundamental values mentally process the same information differently and form dissimilar beliefs.
What is the evidence for motivated cognition? Testing this theory is complicated because people with disparate fundamental values also differ in other ways, such as in their cognitive capacities, and they often get exposed to dissimilar information. Therefore, to identify the existence of motivated cognition, one needs to exogenously vary individuals’ fundamental values without altering their information sets, a task seemingly impossible in most ordinary field settings. In other words, how are you going to shift individuals’ fundamental values to see how they respond to the same information?

In this paper, the authors meet this challenge by studying whether religious norms, a core aspect of fundamental values, causally shape religious followers’ acquisition of religion-related information. The authors focus on a unique empirical setting, where the month of Ramadan (the ninth month of the Islamic calendar observed by Muslims who engage in fasting, among other activities) overlapped with China’s extremely high-stakes College Entrance Exam (CEE) between 2016 and 2018. Existing research reveals that taking the exam during Ramadan leads to substantially worse exam performance for Muslim students. Consequently, Muslim students who were about to take the CEE (during Ramadan) in 2018 were facing a stark conflict: their own religious values vs. the secular cost of fasting during exams.
With motivated cognition, that conflict is not as obvious as it may appear to an outsider. Muslim students who believe they must fast during the CEE might distort the undesirable empirical evidence on how Ramadan affects exam performance to avoid feeling upset about this information. That is, the cost of fasting may not appear as high to these students as it otherwise might. To test this hypothesis, in 2018, the authors conducted a lab-in-the-field experiment among Muslim students who were about to take the CEE during Ramadan. The authors randomly offered half of the students reading materials in which well-respected Muslim clerics use Quranic reasoning to explain the permissibility of exemption from fasting until after the exam. This “pro-exemption” reading material is expected to change what is perceived by the students to be acceptable fasting behavior (i.e., fundamental values).
The authors then presented these students with a previously unreleased graph (see accompanying Figure), which shows that the CEE performance gap between Muslim and non-Muslim students remained stable between 2011 and 2015, but suddenly enlarged substantially in 2016, when the CEE started to fall in the month of Ramadan. The students were asked, in an incentivized manner, to read from this graph the magnitude of the 2016 CEE performance gap between Muslim and non-Muslim students, a purely objective question. In the absence of motivated cognition, whether they “trust” or “like” the information in this graph should only affect how they use that information to update their priors but should not affect what information they see from the graph. The authors find the following:
- Control students who do not receive the pro-exemption reading material systematically misread the purely objective statistic in the accompanying figure; on average, they underestimate the 2016 CEE score gap between Muslim and non-Muslim students by about 17%.
- In contrast, among students who have read the pro-exemption article, their reading of the same graph is significantly more accurate; they under-estimate the gap by only 9.5%, which is a more than 44% reduction in under-estimation compared to the control students. This treatment effect is driven by students who strictly practiced Ramadan fasting in the past, consistent with the intuition that an exemption from fasting should not have salient impacts on students who do not strictly fast anyway.
- This work also reveals suggestive evidence that alleviating motivated cognition makes students better informed about the costs of Ramadan, and thus they find it more acceptable to postpone fasting for the CEE.
Bottom line: These findings offer important insights into motivated cognition that extend beyond religious observance to include such issues as climate change, vaccination, among others. To effectively disseminate important information on polarized issues, it is crucial to first identify and intervene against the underlying fundamental values that might prevent individuals’ accurate digestion of high-stakes information.
-
In response to the financial crisis that fueled the US Great Depression, Congress passed the Glass-Steagall Act in 1933 to separate commercial and investment banking. The goal was to prevent risky investments from threatening a bank’s—and thus the entire banking system’s—viability. Almost since its inception, efforts were made to roll back Glass-Steagall, finally succeeding in 1999 with the passage of the Gramm-Leach-Bliley Act (GLBA), which eliminated restrictions on the affiliations of commercial and investment banks (while also adding safeguards to address stability concerns). For some observers, GLBA was the tinder that ignited the financial crisis and Great Recession of 2007-2009.
As if on cue, Congress responded to this latest financial disaster by passing the Volcker Rule in 2013—advocated by the legendary former Federal Reserve Chairman, Paul Volcker—which harkens back to Glass-Steagall and bans proprietary trading by US banks. Europe discussed similar bans but took a different path by requiring universal banks (or those that provide a wide variety of services, from traditional banking to investing) to have organizational structures (e.g., ethical walls) that mitigate conflicts of interest arising from combining investment and corporate banking under one roof.

However, how effective are such organizational structures? Do those ethical walls actually prevent information and incentives from getting to the other side? Data limitations make these and related questions difficult to answer and have limited many researchers’ analyses. The authors of this paper, though, employ data that allow them to investigate proprietary trading by universal banks, which in turn allows them to assess the effectiveness of organizational structures with respect to information flows from the lending to the trading desk and the associated conflicts of interest.
Please see the working paper for a detailed description of the authors’ methodology, but in brief the authors focus on bank trading ahead of material corporate events that release new information to the market. The lending side of banks could obtain such information prior its release. For example, corporate debt contracts include clauses that require borrowers to inform their lenders, on a regular basis, about material changes to the business. Does this potentially private information from the borrowers make it to banks’ trading desks? Since these information flows cannot be directly observed, it is difficult to know.
To examine this question, the authors combine several large micro-level data sets provided by German supervisory agencies as well as a comprehensive database for corporate events for German firms. The trading data include all individual trades by all financial institutions with a German banking license that are executed on any domestic or foreign exchange or in the OTC markets. In what is likely the first such analysis, the authors analyze around 168 million trades (with a volume of €3.5tn) around 39,994 corporate events to find the following:
- Relationship banks (a firm’s largest lender or a lender that accounts for at least 25% of the firm’s loans) purchase more shares than non-relationship banks in the weeks prior to events with positive news (i.e., positive market-adjusted returns). Further, the authors find negative net positions for relationship banks ahead of events with negative returns, although the results are weaker.
- Strikingly, relationship banks build significant net positions prior to unscheduled positive and negative events, which are harder to anticipate and for which it should be harder to build positions in the “right” direction.
- Relationship trading contributes 14% of banks’ total event-trading profits, even though relationship bank-event combinations account for only 1% of all bank-event combinations.
- For all banks, successfully trading around corporate events is only marginally better than chance. However, for relationship banks, the probability of successfully trading increases by 6.2pp for unscheduled events with absolute abnormal returns above 2%, and further increases to 8.3pp when the authors restrict the analysis to banks with net positions above 0.5bp of the underlying stock’s market capitalization.
The authors also conduct a series of tests and analyses to shed light on the mechanism for these findings, to rule out bank specialization as an explanation for their results, and to study banks’ trading strategies when executing informed trades. Very broadly, their results find that:
- Banks have profitable positions around corporate events only when they concurrently have lending relationships.
- The informed trading results are stronger when information flows from the borrower to the bank are more likely, such as when granting new loans or before M&A transactions.
- Relationship banks also trade profitably in other firms when they have joint information events with their clients. The probability of successfully trading around such joint events increases by roughly 20pp.
- Exploring the role of banks’ risk management function, the authors analyze whether relationship banks are more likely to unwind an existing short (long) position before unscheduled positive (negative) news events. In these situations, the risk management could adjust the limits and thereby passively transmit information.
- Relationship banks shroud their trades to fly below the radar of the supervisor.
- Finally, relationship banks obtain worse prices for borrower stocks in the OTC market, where the identities of the trading parties are known, suggesting that other market participants are aware of relationship banks’ information advantages.
Bottom line: Policymakers and regulators should take note. These findings not only underscore potential conflicts of interest in universal banking, but also question the extent to which banks’ organizational structures are effective in preventing information flows from the lending side to the trading desks. Based on the results, it seems that the ethical walls are porous, at least in an economic sense. Importantly, however, the information flows do not have to be direct, but could also occur indirectly via organizational structures that collect information centrally. Thus, in a twist that should give regulators pause, the findings point towards organizational structures that were strengthened since the Great Recession.
-
Governments of 40 countries, representing at least 58% of the global population, have developed messaging systems to inform the public of military threats during conflict. Despite the importance of alert systems and their extensive use, and although it is intuitive to expect civilians to act, there is no evidence to date on whether and under what conditions these alerts impact public behavior.

How do people’s movements shift in the moments following notification of imminent threats? Does their response time vary over time as a conflict persists? These are important questions for public policy. In order to minimize harm while enabling continued economic and social activity during a conflict, public actors need a mechanism for transmitting information that enables the public to seek shelter and calibrate their movements with respect to the militarized environment.
To address this issue, the authors devise a methodology to reliably measure how people’s movements shift in the moments following notification of imminent threats, and they apply this methodology to events in Ukraine following the February 2022 invasion by Russian forces. In doing so, they provide the first credible estimates of behavioral change in response to government alerts about imminent risk. After the incursion of military forces into urban areas, the Ukrainian government coordinated and developed a smartphone application for transmitting public alerts about impending Russian military operations. These messages were then re-circulated via a collection of mobile device applications as well as through social media platforms (e.g., Telegram). The authors compile these messages to quantify the information available to civilians, and they combine the location and timing of these messages with device mobility.

This pairing of messages and mobility enables the authors to study whether mobility changes discontinuously as alerts are transmitted to mobile devices. This quasi-experimental approach provides credible estimates of costly, real-world responses to alerts during conflict. Relying on estimates from more than 3,000 local, device-by-minute event studies, the authors document five core findings:
Civilians, on average, respond sharply to alerts, rapidly increasing their movement patterns as they flee imminent harm.
These rapid post-alert changes in civilian movement attenuate substantially as the
war progresses.Post-alert changes in vertical movement suggest widespread use of underground shelters, which attenuates with time.
Public responsiveness attenuates even when civilians are exposed to higher
quality information.Post-alert movement patterns more rapidly attenuate when the local population has been living under an extended “state of alarm” (high duration of recent bombardment alerts). Taken together, these results are consistent with the presence of an alert fatigue effect.
Finally, to quantify the consequences of diminished public responsiveness to government messages, the authors conduct a series of exercises to suggest that between 8-15% of civilian casualties could have been avoided if post-alert responsiveness had remained the same over time.
Bottom line: For policymakers hoping to minimize harm during a military conflict, this work reveals that government messaging is a powerful tool, with one important caveat—public engagement is essential.
-
Recent research has made claims that place of residence during childhood is an important determinant of social mobility, stimulating interest in policies that promote such mobility. On the other hand, an established and more often-replicated body of literature emphasizes the role of family influence, primarily that of the mother. This paper contributes to this literature by critically analyzing programs meant to enrich family life and the early lives of children, with an eye toward the long run.
Much of the current literature is unclear about how best to supplement family life. Some advocate income transfers, but childhood disadvantage encompasses more than income to include parental characteristics like education, mental health, parenting style, or quality of home life. Also, childhood disadvantage might equally encompass the quality of parent-child interactions, which are known to foster child development.

Figure 1 offers an illustration of the crude meta-analyses that often dominate discussion in the recent literature, and which compare programs that differ greatly in terms of target populations, interventions administered, and measures used to gauge success. The figure compares programs that originated without any attempt at standardizing the populations studied, that are based on measures taken during early childhood and shortly after the end of the programs, and that do not consider their lifetime consequences. Likewise, assessments of these programs are incomplete.
This paper takes a different approach. When the authors examine influential programs that supplement the family lives of children, they do so with an emphasis on long-run child development and with a focus on understanding the mechanisms underlying successful programs in all populations. In doing so, they isolate a central component that promotes child development: parenting.
All of the successful programs that the authors study promote parenting—attachment, guidance, and support—even though the studies themselves are superficially very different. Some are omnibus programs that have many features promoting child development. Others are more focused, home-visiting programs, that are much less expensive and demanding to operate than omnibus programs. Either way, the authors’ discovery of this common thread across successful programs is supported by powerful evidence on the effectiveness of low-key, and low-cost, home-visiting programs.
Bottom line: Parents and parenting skills are key. Advocates who hope to develop the next best ECD program by, for example, improving teacher and facility quality, or increasing the supply of nurses and other professional personnel, are largely barking up the wrong tree. Instead, by searching for common mechanisms and relationships that transport across environments over the long term, this research reveals the power of parenting programs that foster the home life of children, and, thereby, promote social mobility within and across generations.
-
Despite record-setting speed in the development, approval, and distribution of effective vaccines, the COVID-19 pandemic is responsible for excess global deaths of 7 to 13 million, reduced economic input of nearly $14 trillion (by 2024), and lost future wages resulting from school disruptions of over $10 trillion. It was more than two years before there was sufficient supply of vaccines globally for anyone who wanted a vaccine to have access, exacerbating the human and economic toll.
With such strong demand for vaccines, why did private pharmaceutical companies fall short in delivering supply? Social and political pressure kept vaccine prices low: the value of being able to produce one course of vaccine in Jan 2020 was $1,500 but the price was between $6 and $40. With low prices and a high chance of failure investing in large scale vaccine production facilities before FDA approval was very risky, despite the huge societal costs of delay. The solution is not allowing companies to charge more for vaccines during a crisis but to reduce risk by subsidizing large scale vaccine production plants and associated inputs.

By combining data on the frequency of pandemics of different sizes with estimates of the economic costs, the authors estimate the expected annual social value lost to future pandemics across a range of scenarios. Under conservative assumptions their base scenario implies losses of over $800 billion from future pandemics worldwide, with some plausible scenarios approaching $2 trillion.
What to do? Advances in vaccine technology, such as mRNA vaccines, have increased our ability to rapidly develop vaccines for new diseases although traditional vaccine technology also remains powerful. Putting additional vaccine production capacity in place now so that we can rapidly produce new vaccines would sharply reduce the time until sufficient vaccines were available worldwide, saving both lives and livelihoods. Specifically, spending $60 billion to expand production capacity for vaccines and supply-chain inputs, and $5 billion annually thereafter to maintain these facilities, would guarantee production capacity to vaccinate 70% of the global population against a new virus within six months, generating an expected net present value (NPV) of over $400 billion. If the United States went it alone with contracts to firms to build capacity and agree to turn it over to pandemic production would generate benefits (net of program costs) of $47 billion or $141 per capita just from the next significant pandemic.
Investment by one country in expanding the capability to produce vaccines in advance of a pandemic has positive benefits to others, unlike fighting over a fixed supply of vaccine once it is produced. These positive spillovers mean that the most efficient way to do the investment is a coordinated global program but individual countries who go it alone will in most cases reap substantial gains because they will have first access to supply. For example, an advance-investment program would provide Brazil net benefits of $57 per-capita.
While much of the world suffers from pandemic fatigue, now is not the time to relax. Expected losses form the next pandemic are too high to ignore. Investing now in building the capacity to rapidly vaccinate a large percentage of the population against a new virus is a highly effective way to dramatically reduce the cost of future pandemics. And time is already running short. Valuable mRNA vaccine capacity at threat of being decommissioned, suggesting that we have failed to learn the lesson of Covid-19: Advance global investment in vaccine capacity is key to dramatically reducing the human and economic toll of a pandemic.
-
Important questions regarding the COVID pandemic and the labor force are the degree to which the virus would shift employee attitudes about social distancing at work even after the pandemic ends, and what effect such intentions would have on labor force participation and potential output, as well as on the college wage premium.

Answers to these questions are found in the monthly Survey of Working Arrangements and Attitudes (SWAA), which the authors have fielded since May 2020 to thousands of working-age Americans with prior-year earnings of $10,000 or more, yielding individual-level data on demographics, labor force status, working arrangements, concerns about infection risks, social distancing intentions, and more. The authors analyze SWAA data from February to July 2022 to find the following:
- Nearly 13 percent of SWAA respondents say they will not return to pre-COVID activities after the pandemic ends. Instead, they plan to avoid subways, crowded elevators, taxis, ride-hailing services, and dining at indoor restaurants.
- Another 46 percent will continue limited forms of social distancing, a phenomenon the authors coin as “Long Social Distancing,” which is more common among older persons, women, the less educated, and those who earn less.

The authors also distinguish among those who are strongly committed to social distancing, which they term “strong-form Long Social Distancing,” to find that:
- Strong-form Long Social Distancing is especially prevalent among those who did not attend college, exceeding 17 percent for this group.
- It rises with age, roughly doubling from the early 20s to the early 60s.
- It is higher for women than men at all ages.
- It is about 3 percentage points higher for Democrats than for Republicans, and higher yet for Independents.
- It is more common when remote work opportunities are fewer.
Finally, the authors also estimate that Long Social Distancing reduced the labor force participation rate by 2 to 2.5 percentage points in the first half of 2022, or 1.4 points on an earnings-weighted basis.1 The authors find large effects on the participation of non-college workers, moderate effects on those with some college, and small effects on the participation of the college educated. Further, the authors’ estimates imply that Long Social Distancing reduced output by nearly 1 percent and shrank the college wage premium by 1 to 2.6 percentage points.
Bottom line: This research suggests that Long Social Distancing and its effects will persist for many months and perhaps years. The authors acknowledge that this phenomenon is likely heightened by worries—and real effects—surrounding long COVID, a medical condition that can impair worker capacity.
1In computing the 1.4 percent figures, the authors weight each person’s outcome by his or her earnings. Thus, someone who earns twice as much as the average person gets twice as much weight in the calculation as the average person.
-
Globally, 2.8 billion people breathe hazardous air and 1.5 billion contend with polluted water, with severe impacts on health, labor productivity, and welfare. One way that governments address this problem is to collect and disclose firm-level emissions data, which allows regulators and citizens to identify violators of environmental standards. Even so, many polluters go unpunished as governments routinely fail to achieve compliance with their own standards.
As the world’s largest polluter and manufacturer, and as one of many countries that suffer from imperfect environmental compliance, China offers an instructive example. China manages one of the few and largest systems in the world to automatically collect hourly emissions data and to disclose that data publicly in real time. Emissions from 25,000 major polluting plants covering more than 75 percent of the country’s total industrial emissions, are publicly listed on a website. Despite that excessive polluters have nowhere to hide, in 2019 more than 33 percent of the CEMS firms committed pollution violations.
Interactive Chart: Increasing the Visibility of Appeals on Social Media Lead Regulators to Become More Responsive
Why is non-compliance prevalent when regulators can accurately identify violations? Regulatory challenges abound, including resource-intensive onsite investigations that are required to issue fines or shutdowns. Local governments not only face resource constraints, but given the economic costs of punishments, there is also the possibility that large polluters will defy or even capture local regulators.
Enter China’s citizens. The country has created official channels for the public to report violations of standards and to pressure regulators, while environmentalists and NGOs are increasingly leveraging social media platforms to call for actions against polluters. This type of citizen involvement in environmental governance is an idea that is gaining momentum, but questions remain about whether and how citizen participation in environmental governance can improve environmental outcomes.
To investigate this bottom-up approach, the authors conducted an eight-month experiment across China. Using data to identify violating firms, they randomly assigned firms to either an experimentally assigned control group, or one of several treatment groups, and recruited citizen volunteers to file messages appealing for action when firms in the treatment group violated pollution standards. Citizen volunteers filed either private appeals (i.e., calling a government hotline or sending a private message to a government official or firm) or public appeals sent through the popular Twitter-like Chinese social media site Weibo, potentially observable by more than 500 million users. For all pollution appeals, a script was provided to ensure that content and wording were comparable, but not identical, across channels. The researchers found the following:
- When citizens used social media to highlight violations and to appeal for enforcement, firms committed 62 percent fewer violations, and air (SO2 emissions) and water pollution (COD emissions) declined by 12.2 percent and 3.8 percent, respectively. In contrast, private appeals decreased violations only modestly, even when citizens used the same content and wording as the public appeals.
- When the researchers randomly increased the visibility of the Weibo posts by “liking” and “sharing” them, local regulators became 40 percent more likely to reply to the appeal, and the length of their replies doubled. Further, regulators became 65 percent more likely to conduct an onsite investigation of the violation, suggesting there is much opportunity for regulatory efforts to improve.
- Increasing the amount of citizen appeals in a local region does not lead to higher violation rates or emissions from non-appealed firms, implying that citizen participation does not crowd out other local regulatory efforts.
Bottom line: Engaging the public in efforts to reduce pollution can significantly reduce air and water pollution. Additionally, social media is a powerful tool to facilitate citizen involvement in policy implementation and to hold regulators accountable. And these lessons extend beyond China to include countries like the United States, Canada, India, Indonesia, and others looking to citizen engagement to overcome environmental enforcement challenges.
-
When most people consider foreign trade, they likely imagine direct trade among international firms, say a firm from Germany trading with a company in Spain, or a US firm trading with a Japanese company, and so on. However, international trade is not limited to direct trading among firms; rather, indirect trade also occurs, wherein smaller and often less productive firms buy and sell from domestic firms that import or export.
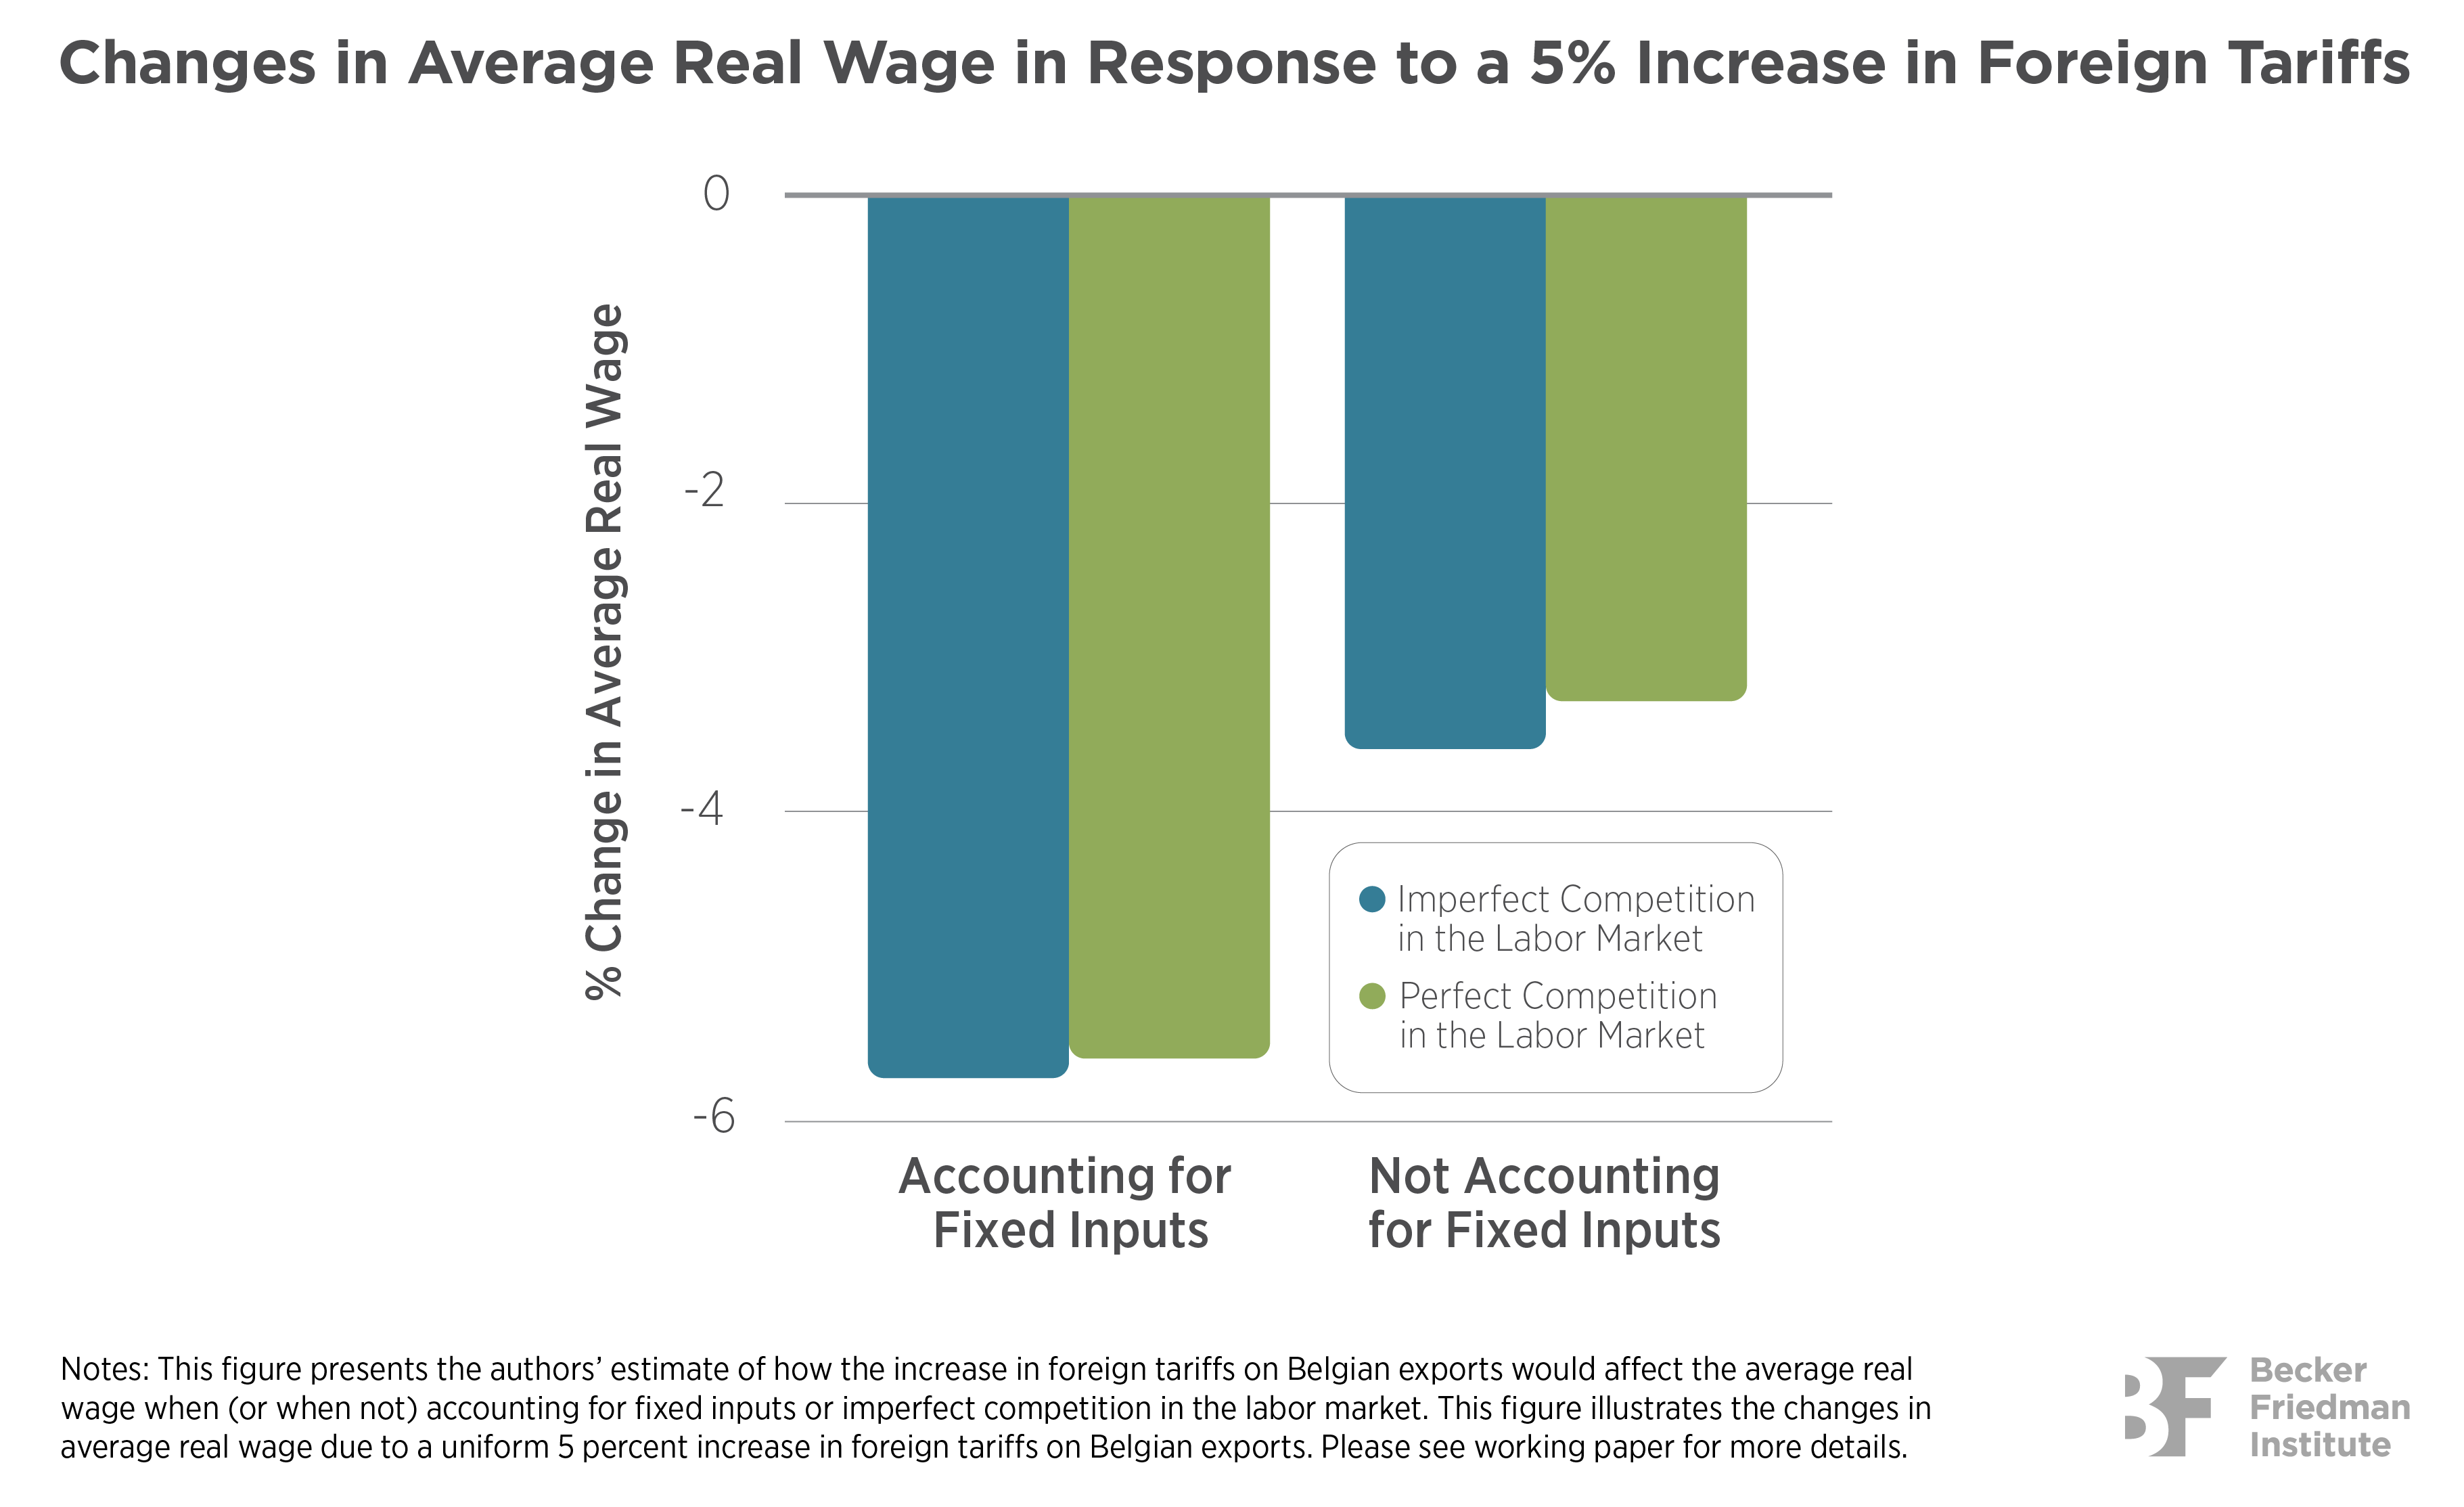
While more is known about direct foreign trade, important questions remain about domestic transactions that are indirectly related to international trade, for example: How do changes in foreign demand transmit from one firm to the next in the domestic production network? How are firms responding to and workers affected by foreign demand shocks to direct exporters and their domestic suppliers? What are the aggregate implications of foreign demand shocks for output, input costs, and real wages?
To study these questions, the authors employ a rich dataset of firms and workers from Belgium from 2002-2014. The data include input factors and output, customs records, imports and exports, and a value-added tax (VAT) registry with information on domestic firm-to-firm transactions, as well as social security records and employer-employee data worker earnings, hourly wages, and work hours. This dataset allows the authors to determine how firms and workers are connected to foreign markets, whether directly, indirectly, or both, and they uncover three key facts about the Belgian economy:
- The authors characterize the relationships in the data between (changes in) firm-level sales, labor costs, and intermediate input purchases, to find that input purchases respond nearly proportionally to changes in sales. In contrast, changes in sales are associated with less than proportionate changes in labor costs, which is consistent with firms facing fixed overhead costs in labor inputs, whereas intermediate inputs (such as energy and materials) are predominantly variable costs in production.
- Even though direct exporters are rare, most firms are indirectly exporting, a finding that stresses the importance of incorporating indirect exports when measuring firms’ ultimate exposure to foreign demand.
- Firms that are more exposed to foreign markets are larger, more productive, and pay higher wages, and these wage differentials are not entirely explained by observed or unobserved differences across workers. This finding suggests that canonical models of competitive labor markets, where wages depend only on the marginal product of workers and not the firm for which they work, are incomplete.
Having established these empirical findings, the authors employ a small open economy model to investigate the relationships between the variables among the data. Please see the working paper for a detailed description of the model, but it is worth noting here that on top of what standard models assume, their model allows for imperfect competition in the form of monopsonistic competition in the labor market (where firms exercise labor market power). The authors’ model also allows for the production of goods to require fixed overhead inputs in terms labor and intermediate goods purchased from other producers.
How then, do firms respond to changes in sales induced by foreign demand, and what are the impacts on workers? The authors’ estimates of firm responses suggest that Belgian firms pass on a large share of a foreign demand shock to their domestic suppliers, face upward-sloping labor supply curves and, thus, have wage-setting power, and have sizable, fixed overhead costs in labor.
When the authors analyze the aggregate effects of a 5 percent increase in foreign tariffs on Belgian exports, they find that the increase in foreign tariffs produces a substantial 5.7 percent drop in the average real wage. By comparison, based on the assumption that the economy had no fixed costs and perfectly elastic labor supply, the predicted reduction in real wages would be as low as 3.3 percent—a substantial difference.
Bottom line: The way that economists typically model foreign demand shocks on the labor market—with no fixed costs and perfectly elastic labor supply—may grossly understate the decline in real wages due to an increase in foreign tariffs.
-
Economists have long argued that innovation is an essential driver of economic growth, with some estimates suggesting that roughly 50 percent of US annual GDP growth is attributable to innovation. Likewise, policymakers have long paid particular attention to stimulating innovation and to the supply of new technologies, while economists have studied both pecuniary and non-pecuniary aspects of technology adoption.
However, innovation alone cannot drive growth; users must also adopt new technologies. Likewise, an effective innovation is not measured by its potential returns but, rather, on its effective returns to scale, and “scale” is the operative word driving recent research. For example, research questions revolve around whether small-scale research findings persist in larger markets and broader settings. Further, what happens when interventions are scaled to larger populations? Should we expect the same level of efficacy observed in the small-scale setting? If not, then what are the important threats to scalability? More than an academic exercise, a proper understanding of these and related questions can avoid wasted resources, improve people’s lives, and build trust in the scientific method’s ability to contribute to policymaking.

This work explores the scale-up problem for an important class of new technologies in the energy space—thermostats that leverage smart functionalities and, thus, hold up the promise of more efficient energy use. The authors examine data from two framed field experiments, wherein the 1,385 households that volunteered to participate in the study were randomized into either a treatment group that received free installation of a two-way programmable smart thermostat, or a control group that kept their existing thermostat. The authors analyze energy consumption over an 18-month period that includes more than 16 million hourly electricity use records and almost 700 thousand daily observations of natural gas consumption, to find the following:
- Smart thermostats have neither a statistically nor economically significant effect on energy use. Indeed, some estimates suggest smart thermostats may actually increase electricity and gas consumption by 2.3% and 4.2%, respectively. These results mirror a growing body of research on the real-world effects of “energy efficient” technology.
- Smart thermostats under-deliver on the savings promised by engineers. By employing a model that better incorporates human adaptation to the technology adaptation, and checking that model against higher-frequency data, the authors can investigate whether this aggregate result masks significant, but offsetting, heterogeneous effects that may have implications for how the intervention scales to different settings. The answer is that there is almost no evidence of heterogeneous treatment effects.
- Why do smart thermostats fail to scale from the engineer’s lab to the household’s wall? Because users frequently override permanently scheduled temperature setpoints, and those override settings are less energy efficient than the previously scheduled setpoint. This finding is based on the authors’ analysis of nearly 4 million observations of treatment group heating, ventilation, and air conditioning (HVAC) system activity and user interactions with their smart thermostat in the form of scheduled temperature setpoints, temporary overrides, and HVAC system events.
- Finally, having categorized smart thermostat households into how intensively they use the energy-saving features of their thermostat, the authors find that while some user types realize significant savings, engineering models fail to capture how most people actually use smart technologies, thus limiting the usefulness of their estimates in real-world settings. In other words, while people may adopt smart technology, most use its features in ways that undo purported benefits, suggesting that human behavior is a peril to scaling such technologies.
For policymakers—and researchers—this micro example has a macro bottom line: Projected savings from innovations that fail to account for how people use new technology are often overly optimistic and potentially costly. Innovation for its own sake will not spur economic growth and improve quality of life; users must adapt, and assumptions on user uptake need reality checks.
-
Since it began announcing meeting decisions in 1994, the Federal Reserve has made an ever- increasing volume of information available, including detailed economic and interest rate forecasts, meeting transcripts, post-FOMC news conferences, and intermeeting speeches. The main rationale for these efforts is the idea that the public’s perceptions of monetary policy—including its goals, framework, and future course—play a crucial role in determining policy effectiveness
for the macroeconomy. Perceptions may also drive long-term rates – which matter for example for mortgage lending – by affecting the risk premium component in long-term interest rates. A substantial body of theoretical research therefore supports the notion that perception is no mere response to policy—perception also shapes policy.However, measurement of these perceptions and how they vary over time has been challenging. While monetary policy frameworks—which include various policy tools applied at different levels and at different times—are relatively complicated, they are often described more simply via a policy rule. Researchers have typically relied on macroeconomic time-series data to analyze monetary policy rules, but these data do not capture perceptions and do not account for high-frequency changes in a policy’s parameters.
As a result, important gaps persist between what we know about the public’s perceptions of the Fed’s monetary policy rule, and how those perceptions change in response to policy actions.
To address this gap, the authors develop new estimates of the perceived monetary policy rule each month from forecaster-level Blue Chip Financial Forecasts (BCFF) data. Because these forecasters are professionals, this represents the perceived monetary policy rule of sophisticated economic agents rather than households. Please see the working paper for a full description of the authors’ methodology, but broadly speaking the authors utilize variation across forecasters and forecast horizons to estimate the relationship of Fed funds rate forecasts with inflation forecasts and output gap forecasts (the output gap is the difference between actual and potential output). This allows the authors to estimate the perceived monetary policy rule and to detect parameter shifts at substantially higher frequencies and over a longer historical period than previous work. In other words, they can more closely gauge when shifts in perception occur to infer why they occurred.
Using their new measure, the authors find the following:
- First, the perceived weight that forecasters put on output drops toward the end of tightening cycles and monetary easing cycles but rises before, and at the beginning of, tightening cycles. The Fed is hence perceived to get ahead of the curve at the beginning of easing cycles, but to tighten in a gradual and data-dependent manner.
- Second, forecasters appear to update their estimates of the perceived monetary policy output gap weight following monetary policy announcements in the direction predicted by rational learning, but in a gradual or even sluggish manner.
- Third, shifts in the perceived rule explain time-varying financial market responses to macroeconomic news releases.
- Fourth, predictable forecast errors for the federal funds rate are more likely to arise when the perceived policy output gap coefficient has increased, indicating that forecasters underestimate the Fed’s response to news, especially prior to tightening cycles.
- Finally, the perceived output gap coefficient is negatively related to subjective bond risk premia, consistent with investors requiring lower bond excess returns when monetary policy is perceived to improve bonds’ hedging properties against macroeconomic risk.
Bottom line: The authors’ evidence suggests that changing beliefs about the monetary policy rule can explain such otherwise puzzling phenomena as when long-term bond yields decouple from changes in monetary policy rates, as occurred in 2004-2005. For central bankers, this research (and the promise of future work), offers insights into the role of perceptions and learning about the monetary policy rule, which is especially relevant for the effectiveness of monetary policy during periods when the monetary policy framework is experiencing substantial review.
-
Before COVID, most people probably spent little time thinking about how many inputs were part of the products that they bought, or from where those inputs originated. However, with the onset of the pandemic and the sudden closure of manufacturing plants around the world, the term “supply chain” suddenly became part of our daily lexicon. Empty shelves in retail stores? Must be supply chain issues. Can’t order a new microwave for months? Supply chain. Depleted auto sales lots? You guessed it.
As COVID illustrated, with production organized around global value chains and with different production stages located in different countries, existing trade models and domestic policy have become increasingly complicated. Researchers have long understood firms’ incentives to import inputs and locate assembly plants around the world; however, that understanding comes from studying each activity in isolation. Most work on horizontal or export platform foreign direct investment (FDI), for example, assumes that assembly only uses local factors of production, while most work on global sourcing or vertical FDI often has final goods that are either non-tradable or perfectly tradable. In part, these choices were made due to theoretical considerations and, importantly, to data limitations.

In this paper, the authors develop a unified framework to study how changes in trade costs, productivity, or demand affect firms’ global production and trade decisions in other countries, and they overcome prior data limitations by combining US data on firms’ detailed trade transactions with country-level information on multinationals’ affiliates and ownership. These new data show that multinational firms (MNEs) account for most manufacturers’ imports and exports, and that their import and export decisions are oriented not only toward countries in which they have foreign affiliates, but also toward other countries in their affiliates’ region. In particular, the authors’ data reveal the following:
- MNEs comprise only 0.23 percent of all firms in the United States, yet employ one quarter of the workforce, account for 44 percent of aggregate sales, 69 percent of US imports, and 72 percent of US exports.
- MNEs constitute only 1.5 percent of all manufacturing firms in the United States, yet account for 87 percent of their imports and 84 percent of their exports.
- MNEs’ contribution to trade flows is due not only to their large size, but also to their higher trade intensities. US MNEs’ ratio of imports to sales is 0.11, almost double the 0.06 ratio for domestic importers.
- Similarly, US MNEs’ ratio of export to sales is 0.10, while domestic importers’ ratio is only 0.05. US MNEs import from an average of 21 countries and export to an average of 40. By contrast, multi-country domestic importers source from an average of 4, while multi-country domestic exports sell to 8 markets.
- Foreign affiliate sales by US MNEs with foreign manufacturing are 74 percent of their total US establishments’ sales, and four times larger than their US merchandise exports.
Bottom line: Understanding MNEs’ trade motives is crucial for explaining aggregate trade flows, with their foreign assembly decisions playing a key role in their global involvement.
What, then, is the relationship between MNE’s trade and FDI decisions? How are these decisions affected by foreign affiliate or foreign headquarter locations? Focusing first on imports, the authors find:
- US MNEs are 53.6 percentage points more likely to import from countries in which they have foreign affiliates, and 7.4 points more likely to import from other countries in the same region as their affiliates.
- Foreign MNEs are 67.8 percentage points more likely to import from their headquarter country, and 9 points more likely to import from countries in their headquarter’s region.
- Foreign firms’ intensive margin of imports is also larger, both for their headquarter country and for other countries in the same region.
These results thus provide new evidence that firms’ global sourcing strategies are oriented towards those regions in which they have multinational activity, and that for US MNEs, this reorientation is driven solely by variation in their extensive-margin import decisions. Regarding exports, the authors find:
- US MNEs’ exports are also oriented toward their foreign affiliate locations: they are 46.3 percentage points more likely to export to a country in which they have an affiliate, and 8.7 points more likely to export to another country in their affiliate’s region.
- Their intensive margin of exports is also higher, both to countries with affiliates, and to other countries in their affiliate’s region. These and other findings regarding MNE exports are at odds with existing economic models.
Addressing this theoretical gap, the authors then develop a multi-country model in which firms jointly decide on their assembly and global sourcing strategies. Please see the full working paper for description of the model and how it improves upon existing frameworks, but we note here that the authors’ model delivers novel predictions on the effects of trade cost changes from, say, tariff increases on MNEs’ imports and foreign affiliate sales. Just as in the real world, the authors’ model reveals the interdependence of firms’ extensive margin sourcing and assembly decisions; in other words, they are not limited to plant-level fixed costs as in existing models.
For researchers and policymakers, this work highlights the importance of incorporating the authors’ new source of firm-level scale economies when studying the effects of trade cost changes in a globalized world with complex supply chains. One important example: This new framework can better describe how tariff changes ripple through economies as they influence the distribution and scale of firms’ global operations.
-
Does internet use lead to improved portfolio choices by households, or does it amplify behavioral biases? Early studies suggest the latter: In the 1990s, individuals that adopted online stock trading platforms increased their trading activity and trading costs without any apparent increase in risk-adjusted returns. More recently, social media usage appears, at best, to have mixed effects on the quality of financial decisions. New work by Hvide et al. (2022) challenges the conventional wisdom and suggests that internet use greatly improves financial decision-making.

The authors study a program rolled out by the Norwegian government in the 2000s that aimed at ensuring broadband internet access throughout the country. Detailed data on all stock and fund transactions made by all Norwegian individuals allow the authors to construct measures of stock market participation and portfolio composition. Comparing over time the investment decisions of individuals with and without broadband access, the authors find:
- Broadband internet use leads to increased stock market participation, driven by an increase in the share of the population investing in equity funds. The authors find no effect of internet use on the share of the population holding common stocks. The effects are economically significant: For every 10-percentage point increase in broadband use, the stock market participation rate increases by 0.7 percentage points, that is, about 5.3 percent of the pre-reform mean stock market participation rate.
- Existing investors on average do not increase their stock trading activity following the introduction of broadband, though there is a slight tendency for the most active traders to become even more active. Moreover, existing investors tilt their portfolios toward equity funds, thereby obtaining more diversified portfolios and higher Sharpe ratios (a measure of risk-adjusted returns), as well as higher portfolio efficiency.
- To better understand the mechanisms underlying the two main findings, the authors use nationally representative survey data on households’ internet activities. Theory suggests that entering financial markets involves fixed costs such as becoming aware of stock market opportunities and acquiring financial competence, and it is plausible that high-speed internet would facilitate these activities and thus reduce fixed costs. The survey data support this interpretation: Over the broadband expansion period, the authors observe a broad trend towards increased internet-based information acquisition and learning. Heterogeneity analyses also point towards an information acquisition channel: Compared to pre-reform stock market participation rates, the effects of broadband on stock market participation are stronger for low-SES households who have the lowest stock market participation rates and likely the lowest financial literacy to begin with.
- Finally, the authors use household balance sheet data to show that broadband internet use increases households’ financial wealth and their return on financial wealth.
Bottom line: The authors’ two key findings, as well as their supporting analysis, suggest positive effects of broadband internet on the financial decision-making of individual investors.
-
The COVID-19 pandemic triggered a huge, sudden uptake in working from home, as individuals and organizations responded to contagion fears and government restrictions on commercial and social activities. Over time, it has become evident that the big shift to work from home (WFH) will endure after the pandemic ends, which raises important questions, including: What explains the pandemic’s role as catalyst for a large and lasting uptake in WFH? What does this shift portend for workers? Specifically, how much do they like or dislike WFH? How do preferences in this regard differ between men and women and with the presence of children? How, if at all, do workers and employers act on preferences over working arrangements?
Deep Dive: Working from Home Around the World
To tackle these and related questions, the authors field a new Global Survey of Working Arrangements (G-SWA) in 27 countries that yields individual-level data on demographics, earnings, current WFH levels, employer plans and worker desires regarding WFH after the pandemic, perceptions related to WFH, commute times, willingness to pay for the option to WFH, and more. (Please see the full working for details on the survey methodology.)
Employers plan an average of 0.7 WFH days per week after the pandemic, but workers want 1.7 days, considerably more, a gap that is confirmed by other survey work. Looking across individual, actual WFH rates rise with education as of mid 2021, early 2022, and according to employer plans for the post-pandemic future.
Separate data on job vacancy postings suggest that employers are gradually warming to WFH for one or two days per week in many jobs, and most or all the time in some jobs. The share of vacancy postings that say the job allows for remote work has trended upward from the summer of 2020 through the summe of 2022. These and other patterns suggest that remote-work practices are becoming more firmly rooted, even as COVID deaths decline. Finally, the share of US patent applications that advance video conferencing and other remote-interaction technologies doubled in the wake of the pandemic, suggesting that remote-work technologies will continue to improve, further encouraging the use of remote-work practices.
The authors offer a three-part explanations for how the pandemic catalyzed a large and lasting shift to WFH:
- The pandemic compelled a mass social experiment in WFH.
- That experimentation generated a tremendous flow of new information about WFH and greatly shifted perceptions about its practicality and effectiveness.
- Finally, this new information and the shift in perceptions about the value of WFH caused individuals and organizations to re-optimize working arrangements.
As to how this experimentation influenced perceptions and practices about WFH, the authors find two results:
- Relative to their pre-pandemic expectations, most workers were surprised to the upside by their WFH productivity during the pandemic. Only 13 percent of workers were surprised to the downside, and nearly a third found WFH to be about as productive as expected.
- The extent of WFH that employers plan after the pandemic rises strongly with employee assessments of WFH productivity during the pandemic. This pattern holds in all 27 countries in the authors’ sample and indicates that large-scale experimentation with WFH permanently shifted views about the efficacy of remote work and, as a result, drove a major re-optimization of working arrangements.
The authors’ many findings include the following (please see the interactive feature above that displays detailed responses to survey questions):
- Employers plan higher post-pandemic WFH levels in countries with higher Cumulative Lockdown Stringency (CLS) index values. The CLS is a composite measure that captures government-mandated school closures, business closures, and stay-at-home requirements.
- Cumulative COVID deaths per capita have no discernable impact on planned WFH levels (or actual WFH levels as of mid 2021 and early 2022).
- Employees view the option to WFH 2-3 days a week as equal in value to 5% of earnings, on average. Willingness to pay for WFH rises with commute time.
- Women place a higher average value on WFH than men in all but a few countries, as do those with more education.
- Among married persons, both men and women more highly value the option to WFH when they have children under 14.
- 25 percent of workers who currently work from home one or more days per week would quit their job or seek other employment if told that they had to return to the worksite for 5+ days per week.
This rich paper also offers insights into the pace of innovation (the authors are optimistic) and the fortune of cities (challenges will persist as cities face lower tax revenues and other issues related to depleted commercial cores). The authors are also careful in their assessment of whether and how WFH may impact workers. On the one hand, most workers value the opportunity to WFH part of the week, and some value it a lot. The dramatic expansion in WFH benefits millions of workers and their families.
On the other hand, some people dislike remote work and miss the daily interactions with coworkers; over time, though, these people will likely gravitate to organizations that offer pre-pandemic working arrangements. Another concern is that younger workers, in particular, will lose out on valuable mentoring, networking, and on-the-job learning opportunities, a concern that the authors consider serious. However, they stress that firms have strong incentives to develop practices that facilitate human capital investments, and workers also have strong incentives to seek out firms that provide such worker development.
-
Digital advertising is increasingly popular and constitutes most advertising spending, offering the ability to match ads to consumers’ preferences. In part, this means that advertisers benefit when ad providers, like Facebook, can match ads to consumers based on the browsing history of other consumers who share similar characteristics. If you buy a pair of shoes, and Facebook’s algorithm says that you and I are alike, then I will receive an ad for those shoes. Of course the information that you bought a pair of shoes constitutes “offsite” data for Facebook. Alternative outcomes for matching such as browsing history, or items that are currently in a user’s online shopping cart are also not generated on Facebook and are thus also considered “offsite” data.

Such a service is valuable to advertisers, especially those selling niche products who otherwise might find it hard to compete against mass-produced items. In this paper, the authors estimate the value of such “offsite” data using a large-scale experiment across more than a hundred thousand advertising accounts on Meta (Facebook’s parent company). This exercise is particularly pertinent as current—and possibly future—product and regulatory changes loom that may restrict use of such data. In Europe, for example, the General Data Protection Regulation (GDPR) requires explicit consent for users’ individual behavior data to be used for ad targeting. On the product side, Apple’s roll out of their “Ask App Not to Track” feature in iOS 14.5 meant a collective drop in valuation of $140 billion for major advertising platforms, and there is prospective legislation around the world that similarly would limit data sharing.
On the one hand, increasing privacy among consumers is viewed by many as a benefit; on the other hand, this comes at a cost to advertisers who experience fewer returns to their advertising dollars, and to users who are served less relevant ads. As the authors stress, any holistic assessment of costs and benefits should include the effects of policies on the advertising market. To assess such costs, the authors establish two treatment groups, the first includes ad campaigns on Meta that use offsite data (“business as usual,” or BAU), while the second estimates the loss in advertising effectiveness when advertisers lose access to offsite data (“signal loss”). Broadly described, under BAU, Facebook’s algorithms know who buys what; under signal loss, the algorithms only know who clicks which ads on Facebook.
Please see the full working paper for details on the authors’ methodology, but at a high level, the authors run experiments on ad traffic wherein 1) they randomly select some users out from seeing ads, which allows estimations of ad effectiveness at baseline for campaigns using offsite data; and 2) they change a small fraction of traffic to be delivered as if it did not have offsite data. Repeating this process across hundreds of thousands of products, the authors can make statements about both ad effectiveness at baseline, and how much less effective the same campaigns would be without offsite data. They find the following:
- Under BAU targeting using offsite data, the authors estimate a median cost per incremental customer of $43.88, with 10th and 90th percentiles $5.03 and $172.77.
- The authors find a 37% increase in costs of acquiring new customers with the loss of offsite data. Further, about 90% of the estimated underlying effects lie below zero, suggesting a large share of the advertisers will see a decrease in ad effectiveness under signal loss.
- These cost increases are experienced mainly by small scale advertisers, which constitute most of the sample; larger scale advertisers are hurt less.
- The authors also examine the purchasing behavior of users six months after the study was run. Their experiment allows them to see whether ads delivered with or without offsite data generate more longer-term customers of those products, and they find evidence that purchase-optimized ads generate substantially more longer-term customers per dollar than click-optimized ads.
Bottom line: A wide range of advertisers, including those in consumer-packaged goods, e-commerce, and retail, obtain substantial benefit from offsite data.
Finally, while technologies may develop to meet the objectives of both privacy advocates and advertisers, until that day, policymakers and companies must weigh the tradeoffs in altering the offsite data ecosystem.
-
While the connection between family formation and crime has received substantial attention in the qualitative literature, quantitative evidence is sparse, and the question of whether—and to what degree—parenthood affects criminal behavior remains open. This paper uses administrative data covering more than a million parents to take an unprecedentedly close look at how parenthood affects criminal behavior. The authors implement a novel match between Washington State administrative records covering the universe of criminal arrests, births, marriages, and divorces—the largest such study ever conducted in the United States.

These data allow the authors to highlight high-frequency changes in both the timing and type of arrests, distinguishing between desistance that occurs well before a child is conceived and changes after conception, for example. The data’s scale also allows the authors to precisely measure differences in effects across birth order, child sex, parents’ age, and other characteristics that speak to potential mechanisms and reinforce the robustness of the main results. The authors use two primary research designs: a comparison of the age-crime profiles for men and women who have children at different ages, and a comparison of the crime trajectories of parents to live- vs. still-born children. The main findings are as follows:
For mothers:
- Drug, alcohol, and economic arrests decline precipitously at the start of pregnancy, bottoming out in the months just before birth. Shortly after birth, criminal arrests recover but ultimately stabilize at about 50 percent below pre-pregnancy levels. These effects are large compared to other commonly studied interventions.
- The sharpness of the response suggests that these declines reflect the impact of pregnancy rather than the onset of a relationship or other coincident life events. Effects are concentrated in the first birth and among unmarried parents. The authors also find similar positive long-term impacts on teen mothers, for whom virtually all pregnancies are unintended, reinforcing the causal interpretation of the main results.

For fathers:
- Arrests decrease sharply at the start of the pregnancy and remain at lower levels following birth, with reductions around 20 percent for property, drug, and DUI arrests.
- As with mothers, the timing of fathers’ response suggests that pregnancy, not childbirth, is the primary inducement to decreased criminal behavior.
- However, men exhibit a large spike in domestic violence arrests at birth, with monthly rates increasing from below 10 arrests per 10,000 men in the months just before pregnancy to about 15 per 10,000 just after.
- Further, 8 percent of unmarried first-time fathers are arrested for domestic violence within two years following birth. These effects reverse half of the overall decline in arrests from other offenses and are large relative to other known drivers of domestic violence.
For marriage:
- Married parents are consistently less likely to be arrested for any offense, including domestic violence. For both sexes, crime decreases dramatically in the three years prior to marriage. This trend stops at the marriage date, after which offending is flat.
While the authors stress that parenthood is not a policy, they do note that governments take numerous actions to prevent teen pregnancy, support marriage through the tax code, and encourage father’s involvement in their children’s lives. This important new research reveals that some of these policies may have important spillover effects on parents’ criminal activity. In particular, the authors’ findings on the timing of desistance for fathers suggests that pregnancy could be a uniquely favorable time for interventions promoting additional positive changes. As often occurs in economics, though, there is an “other hand:” In this case, the stark patterns in domestic violence arrests may argue for expanding the purview of home visitation programs in the postnatal period, which are typically directed towards the child’s welfare
Finally, this work offers new insights surrounding teen motherhood and its consequences. In particular, the authors’ finding that drug arrests show large decreases after family formation implies that substance abuse may respond to incentives built around social bonds. This explanation aligns with addiction experts who observe the palliative effects of social cohesion (as exemplified, for example, in such programs as Alcoholics Anonymous). Bottom line: Social ties within the family may be a particularly potent source of support for combating addiction. -
Teacher quality has been shown to positively impact such outcomes as test scores and long-run academic and labor market outcomes, but less is known about teacher quality and students’ contact with the criminal justice system (CJC) as young adults. This paper addresses this gap by investigating whether and how teachers impact students’ future chances of CJC.

The authors link schooling and criminal justice records to estimate the variance of elementary and middle school teachers’ effects on students’ future arrest, conviction, and incarceration. To study the drivers of these effects, the authors relate them to teachers’ impacts on standardized test scores and a set of disciplinary and attendance outcomes, which serve as proxies for non-cognitive skills. This allows the authors to ask whether teachers who boost test scores, for example, also decrease their students’ future CJC, and whether teachers who reduce suspensions do the same.
The authors’ data source is a merger of administrative criminal justice and education datasets in North Carolina, including almost two million students in grades 3-12 from 1996-2013, and 40,000 teachers. The criminal justice data include the universe of N.C. arrests and detailed data on case outcomes, including conviction status and sentences. Their analysis of this novel dataset reveals the following findings:
- Estimates of teachers’ direct effects on future arrests, convictions, and incarceration are large: The authors find a standard deviation of teacher effects on future arrests of 2.7 percentage points (p.p.) or 11.3 percent of the sample mean, and on incarceration of 2.1 p.p., or 23.6 percent of the sample mean.
- Teachers who boost test scores or study skills do not meaningfully decrease students’ CJC as young adults. Shifting a student to a teacher with one standard deviation higher effect on test scores decreases students’ likelihood of arrest between the ages of 16 and 21 by less than 0.001 percentage points.
- By contrast, teachers’ impacts on behavioral outcomes are closely connected to their impacts on CJC. Assignment to a teacher who is a standard deviation better on a summary index of discipline, attendance, and grade repetition decreases the likelihood of future CJC by 2 to 4 percent, depending on the outcome.
- These beneficial effects hold across sex, race, socio-economic status, and predicted CJC risk, but they are not perfectly correlated across student types. The correlation of a teacher’s effect on white and non-white students’ criminal arrests is roughly 0.5, for example, indicating important heterogeneity in teachers’ impacts. Effects on short-run outcomes, on the other hand, show tight correlation across groups.
- The authors also examine how teachers’ effects might change across different schooling environments and find that large teacher effects on CJC are most tightly correlated with impacts on behaviors rather than test scores across all contexts.
- Examining policy implications, the authors find that replacing the bottom 5 percent of teachers based on various measures would result in large, long-run improvements, including up to 10 p.p. increases in college attendance and 6 p.p. reductions in criminal arrests for exposed students.
Policymakers take note: Teachers who improve proxies for non-cognitive skills such as rates of school discipline and attendance have meaningful impacts on students’ future arrest, conviction, and incarceration rates. This evidence supports a growing body of research showing that the accumulation of “soft skills” may lie at the heart of the return to education for crime. It also suggests that teacher retention and incentive based solely on teachers’ test score quality may inadvertently miss an important dimension of teachers’ social value.
-
Data are key when making policy, and they are especially important when policymakers must respond to changing conditions in real time. This was made clear during the COVID-19 pandemic, when many households suddenly lost their source of income and policymakers rushed to fill the gap. Unfortunately, official statistics like the poverty rate are only updated on an annual basis, a time lag that renders them nearly useless for making quick policy decisions. Other, more direct measures of economic well-being, such as consumption statistics, are likewise only available after a considerable lag.
These data limitations have jumpstarted research on how to compute income-based poverty measures in near real-time. In particular, the authors of this paper (Han, Meyer, and Sullivan) constructed a measure of income poverty in 2020 that can be updated monthly using data on reported income over the past 12 months from the Monthly Current Population Survey (CPS).1 Researchers at the Columbia University Center on Poverty and Social Policy (CPSP) have taken a very different approach. They define a monthly poverty indicator based on imputed monthly income constructed from annual income from a prior year of the CPS Annual Social and Economic Supplement (CPS-ASEC), and then use this indicator to impute the poverty status out-of-sample for observations in the Monthly CPS.2

A key distinction between these two indicators, in addition to the methodological differences, is that the Han et al. measure defines poverty using an annual measure of resources, while the CPSP indicator defines poverty based on a prediction of resources for a single month. This new work by Han et al. analyzes these two approaches vis a vis changes to the Child Tax Credit (CTC) in 2021. In doing so, this paper provides a rich discussion of how to measure poverty in real time and why it matters, including careful caveats and methodological limitations (readers of this Economic Finding are encouraged to examine the full paper).
Readers may recall that CTC changes in 2021 eliminated work incentives and replaced them with a child allowance, regardless of parental work. Part of this allowance was paid out monthly during the second half of 2021 under what was called the Advance Child Tax Credit. The main finding of this new research reveals that the two different approaches to measuring real-time poverty described above suggest sharply different short-run effects of the policy change on child poverty. On one hand, in one oft-cited study, researchers concluded that child poverty decreased 25 percent in July 2021 because of CTC expansion, and CPSP researchers subsequently claimed that poverty rose by over 40 percent in January after the expiration of the monthly payments. These findings widely circulated among policymakers and the press.
On the other hand, the Han et al. measure described in this paper reveals only a small decline in poverty during the period of monthly CTC payments and no rise after the elimination of the payments. Also, the Han et al. measure registers other pandemic tax credits, specifically Economic Impact Payments, but shows little effect of the Advance CTC. In addition, the authors show that the differences in reference periods across measures cannot fully explain the different patterns, and that other evidence tying changes in well-being to the tax credit changes is also weak.
What explains these different interpretations? Briefly, the claims of poverty changes in the range of 40 percent are based on simulations that do not rely on income data from the period in question. Instead, they simulate income relying on income data from prior years rather than actual reports of current income. The simulations also assume that behavioral responses to cash transfers are absent. The estimates in this paper are based on reported survey income data from the Monthly CPS, which indicate that child poverty rates changed little during and after the period of a temporary child allowance. Further, some of the differences are likely due to monthly vs. annual income simulations by the CPSP, as well as to behavioral responses, and to underreporting of government transfers.
The bottom line: Conclusions that poverty decreased significantly while a child allowance was in place in 2021, followed by a large increase in 2022 when it lapsed, merit greater qualification. Indeed, evidence presented in this paper, which is based on reported rather than imputed income, and for an annual rather than a monthly reference period, suggests that changes in poverty were much more modest.
1This paper has been extended with updated results reported each month at povertymeasurement.org.
2Updated estimates for the CPSP are provided monthly at povertycenter.columbia.edu/forecasting-monthly-poverty-data.
-
On the one hand, one might expect that authoritarian states would have an easier time managing a pandemic like COVID-19 given that the government could force compliance with mask and vaccine mandates, for example. On the other hand, authoritarian governments might take an opportunity like a pandemic to escalate oppression and increase control over society under the pretense of protecting public health. Indeed, studies have shown that democracy and human rights worsened in more than 80 countries since the onset of COVID-19, especially in highly repressive states.

The authors examine the case of Russia to investigate these and related questions by studying regional variance in government response to COVID-19. Before describing the authors’ findings, a brief note about how Russia governs itself. There are 85 regional parliaments in Russia led by governors that, since 2004, are no longer elected by citizens but are rather appointed by the central government (a change made under Putin). Though these regions share a similar culture, language, and history, they vary significantly in the capacity of elites to provide public goods and maintain order, in the strengths of civil society, and in the quality of political institutions.
Any autonomy retained by regional governors is at the discretion of federal authorities. For example, in April 2020, governors were granted special authority to choose measures for preventing the spread of COVID-19 in their regions, which approached the pandemic in profoundly different ways. About 30 regions chose to impose electronic passes to leave the house. Only a few regions declared a force majeure (usually defined as an “act of god”), which allowed businesses to resolve lapsed contractual obligations, while in most cases regions labeled lockdowns as “non-working days,” making it harder for businesses to handle lapsed contracts. In addition, regions varied in the extent of information manipulation about the gravity of the COVID threat and the number of COVID-related prosecutions.

The authors examined the regional variation in government response to COVID-19 to determine whether and how the central government exploited the pandemic to maintain its grip on power. Their analysis of the data, along with the application of a theoretical model that examines the relationship between repression and informational control, finds that the government exploited the COVID-19 pandemic to maintain its grip on power. Some specific findings include:
- Under-reported COVID-19 related deaths, a propaganda tool, reduced the citizens’ willingness to comply with anti-pandemic measures, and therefore contributed to the pandemic harm. Thus, the authoritarian government’s supposed advantage in providing the public good—i.e., implementing coercive public-health measures—was compromised by the government’s own actions to enhance its power.
- While reports of COVID deaths are easily manipulated, aggregate mortality data are more reliable; likewise, the difference between the reported COVID deaths and excess mortality is a ready proxy for the government’s information manipulation. See related Figure for an illustration of the relationship between excess mortality and officially reported COVID-related deaths in democracies and non-democracies.
- Information manipulation by Russian regional authorities is a function of Moscow’s political control. Regions with a strong United Russia majority produce more information manipulation about COVID-related deaths, while regions with higher-quality institutions produce less information manipulation.
- Repression and informational control are natural complements to each other. Repressing those who are most skeptical of the regime allows the government to increase the volume of propaganda for the others. When the skeptics are repressed, their incentive constraint is relaxed, and the rest of the population receives more pro-regime information.
Bottom line: Information manipulation is complementary to repression; the quality of political institutions, the strength of the civil society, and the strength of political monopoly all influence the extent to which the incumbent government can engage in information manipulation and repression.
-
Choices you make are often influenced by your perception of how others may judge you for your actions. For example, would you admit to doing something if you believed that others would think less of you? This phenomenon, known as stigma, is of interest to policymakers because people who might otherwise benefit from a particular program choose to opt out because of perceived stigma attached to participation. Understanding stigma, then, is key to designing effective policies. However, stigma is hard to measure and, thus, little empirical evidence exists on the presence and nature of stigma in shaping decisions.
This paper addresses this gap by introducing a novel approach to study stigma in welfare programs. The authors examine whether failure to report program receipt in surveys is negatively associated with program participation in the census tract of survey respondents. For this relation to provide evidence on the presence and nature of stigma, underreporting needs to be related to stigma, and higher local participation should decrease stigma. In other words, people may be disinclined to admit that they receive welfare payments unless enough of their peers also participate in the program.
As the authors discuss fully, their methodology aligns with the identification strategy in studies of social image concerns, which typically examine how actions vary with the probability that peers will observe those actions. This allows the authors to examine a key determinant of social image concerns: how actions vary with their social desirability to peers. Briefly, the authors find the following:
- Misreporting among true recipients is negatively associated with local program receipt, which is strong evidence for stigma. The authors confirm this finding through empirical evidence from additional analyses. Also, stigma decreases when more peers participate; for example, for Supplemental Nutrition Assistance Program (SNAP) in the American Community Survey (ACS), a 10-percentage point increase in local participation leads to a 0.9-percentage
point decline in the conditional probability
of misreporting. - Stigma effects are stronger in the presence of interviewers (in-person or phone) compared to mail-back responses, where stigma should matter less.
- Finally, the authors test whether their findings are driven by overall survey accuracy being lower when program participation is higher, finding that this is not the case.
The bottom line for policymakers: the authors’ results provide robust evidence that welfare participation is associated with stigma, which is key for improved policy and survey design. Importantly, stigma is stronger when participation among peers is less common, and stigma is amplified in the presence of an interviewer.
- Misreporting among true recipients is negatively associated with local program receipt, which is strong evidence for stigma. The authors confirm this finding through empirical evidence from additional analyses. Also, stigma decreases when more peers participate; for example, for Supplemental Nutrition Assistance Program (SNAP) in the American Community Survey (ACS), a 10-percentage point increase in local participation leads to a 0.9-percentage
-
In his thesis-turned-book, The Economics of Discrimination (1957), Gary Becker wrote that a biased decision maker “must act as if he were willing to pay something” to exercise bias. In other words, you own a store but are willing to forgo sales to certain types of people at a cost to your bottom line. Or you refuse to hire certain candidates based on demographic characteristics even though they are the most qualified. These are the prices that you are willing to pay to discriminate. Becker’s book jump-started research programs on discrimination that continue today, and “willing[ness] to pay” remains a foundation
of that research.However, how can we learn whether the decisions of employers, teachers, judges, landlords, police officers, and other gatekeepers are discriminatory, rather than reflective of other relevant group-level differences? To answer this question, we must first define what it means for a decision to be unbiased, which requires specifying what unbiased decision makers in a particular setting are supposed to be optimizing, what constraints they face, and what they know at the time they make their decisions. We can then derive optimality conditions for the decision-maker’s problem and check whether those conditions are consistent with data for different groups affected by the decision. If these checks suggest that an unbiased decision maker could do better by changing how they treat members of a particular group, the analyst may conclude that this group is subject to bias. In other words, in such a case we may have discovered a decision maker willing to pay Becker’s price of discrimination.
This paper examines what researchers can learn about bias in decision making by comparing post-decision outcomes across different groups. As in many economic inquiries, it is behavior at the margin that matters: when a bail judge, for example, is on the fence about whether to release versus detain a defendant before trial, examining the subsequent pre-trial misconduct outcomes of such a marginal defendant, and comparing the outcomes of marginal defendants of different races, may help reveal a decision maker’s differential standards.
But how can we ensure that differential outcomes in those marginal cases reveal decision maker bias? To answer that, the authors make a novel connection between testing for bias and imposing various flavors of Roy models, which have long been employed by economists to analyze decision making. In his 1951 paper, A.D. Roy describes a world where people choose between hunting and fishing as an occupation, and people differ in their skills in each task. The point of the model is not to observe the aggregated choices, that is, how many choose hunting and how many choose fishing, which is merely a matter of empirics; rather, Roy asks whether those who are relatively more skilled at hunting will hunt, and whether those who are relatively more skilled at fishing will fish, which is a more nuanced question that, like testing for bias, depends on the underlying model of behavior assumed to generate the observed data. Roy models have evolved to incorporate more complexity since A.D. Roy’s original formulation, including accommodating additional factors that influence decision making but are not observable to the analyst.
In outcome tests of bias, the authors show that such unobservable factors can render marginal outcomes, even if perfectly known, uninformative about decision maker bias in the most general member of the Roy family—the Generalized Roy Model—which is a workhorse in modern applied economics thanks to its empirical flexibility. The authors then show how a more restricted “Extended” Roy Model delivers a valid test of bias based on the outcomes of marginal cases. This highlights a tradeoff between the flexibility of a decision model and its ability to deliver a valid outcome test of decision maker bias. Indeed, imposing the Extended Roy Model yields a valid test of bias precisely because it rules out other behaviors that may be empirically indistinguishable from bias, like bail judges considering job loss, family disruption, and other consequences of pre-trial detention beyond the typically measured outcome of pre-trial misconduct.
The authors also discuss ways of taking these models to data across a wide range of real-world settings. They highlight a distinction between econometric assumptions that help identify marginal outcomes using variation across different decision makers, versus modeling assumptions that help derive a valid test of bias based on those marginal outcomes; the former do not necessarily imply the latter. Both types of conditions hold in the Extended Roy Model, however, and due to the restrictions it imposes, it has clear testable implications that may help empirical researchers assess its suitability across empirical settings. The authors also extend their results and discussions to more challenging data environments where variation across different decision makers may not be available, and the analyst attempts to compare average, rather than marginal, outcomes across groups.
Bottom line: empirical description of gatekeeper decisions, and the outcomes that result from those decisions, is not sufficient for detecting bias in decision making; rather, learning about such bias requires specifying and justifying a model that is restrictive enough to deliver testable implications of biased behavior, but rich enough to incorporate the essential elements of the optimization problem faced by decision makers in a given empirical setting.
-
When the US and China engaged in a trade war in 2018 and 2019 there was much focus on the multiple rounds of tariff hikes between the two countries. However, there was also abundant anecdotal evidence about non-tariff regulatory mechanisms imposed by China to stifle purchase of US exports, like inspection delays on certain products, onerous permit requirements, and other targeted efforts to restrain exports from the United States to China.
Non-tariff barriers can have large effects on trade and welfare, but their opaqueness makes them difficult to measure. In this paper, the authors employ Chinese customs level data available through the Tsinghua China Data Center, along with a demand theory model, to infer the use of non-tariff barriers in the U.S.-China trade dispute between 2018 and 2020. This includes China’s use of regulatory measures in 2018 and 2019 at the height of the trade war to punish American exporters, as well as in 2020 to benefit American exporters in China’s effort to end the trade war.
First, the authors estimate the use of non-tariff trade barriers by China in its trade battle with the United States in 2018 and 2019, and in the first year of the purchase agreement in 2020. They first estimate the elasticities of demand for US products in China relative to products made by other countries, and the elasticity of supply of exports to China, to find that:
- Foreign export supply curves are essentially horizontal, which suggests that the incidence of higher Chinese trade barriers—whether tariffs or non-tariff regulations—is entirely borne by Chinese consumers.
The authors then use the estimates of the demand elasticities to back out the changes in non-tariff barriers as the residual of changes in imports of US products relative to imports from other countries of the same product, after controlling for the effect of tariffs. These estimates suggest that:
- Non-tariff barriers on US imports to China increased significantly in 2018 and 2019, by an average of 56 percentage points (in tariff equivalent units) for agricultural products and by 17 percentage points for manufactured products. And in the first year of the Phase 1 agreement in 2020, some of the increase in non-tariff barriers on US agricultural exports was reversed.
- The use of non-tariff barriers was also much more targeted towards specific products compared to the tariffs, and applied largely to non-state importers. For example, the tariff equivalent of non-tariff barriers increased by almost 300 percentage points in 2018 and 2019 for such categories as “oil-seeds,” “cereals,” and “ores, slag and ash.”
The authors also employ a demand theory model to estimate the effect of trade barriers, including tariffs and non-tariff barriers, on Chinese welfare to find that:
- About 50% of the overall decline in US exports to China between 2017 and 2019 was due to higher non-tariff trade barriers, and the other half due to higher tariffs. However, most of the welfare loss incurred by China from the trade war was due to non-tariff trade barriers.
- Specifically, trade barriers imposed in 2018 and 2019 lowered Chinese welfare in 2019 by $40 billion, with 93% of the welfare loss coming from the use of non-tariff trade barriers. This welfare loss is about six times larger than an equivalent import decline due to higher tariffs. Non-tariff barriers are more costly compared to tariffs because they apply to some importers and not others, which results in misallocation and because non-tariff barriers do not generate revenues.
While the authors focus on the 2018-2019 US-China trade war, they offer similar examples of other recent disputes to illustrate the broader impact of non-tariff regulations in trade disputes. For example, when Canadian authorities arrested Meng Wangzhou, the CFO of Huawei, Chinese authorities retaliated on Canadian exports with similar opaque regulatory procedures, like claiming Canadian canola oil was infected with pests, and subjecting other food products to long paperwork delays. Relatedly, after Australia passed a national security law and blocked Chinese companies from its 5G mobile networks, Australian exports of barley were hit with anti-dumping duties, import licenses on Australian beef, lobster, and copper were revoked, and directives were issued to stop buying Australian cotton and coal.
Bottom line: To the extent that the goal of the Chinese government was to retaliate against US tariffs on Chinese products by cutting imports from the US, this work reveals that non-tariff barriers to trade were more costly than tariffs alone, and the burden fell to Chinese consumers. Further, while this work offers important insights into the non-tariff costs associated with the recent US-China trade war, its analysis also provides a useful framework to examine similar effects of other trade disputes.
-
Among its other benefits, schooling may expand students’ underlying capacity for cognition, including the ability to engage in effortful thinking, which constitutes a more expansive view of how education shapes general human capital. This research examines this phenomenon by focusing on how schooling engages students in effortful thinking for continuous stretches of time. In other words, do in-class exercises like reading and other forms of sustained concentration expand cognitive endurance, or the ability to sustain performance over time during a cognitively effortful task? Existing literature suggests that the answer is “yes,” but evidence remains limited.

To address this question, the authors designed a field experiment in a setting where time in focused cognitive activity is limited: low-income primary schools in India. Their sample comprised 1,636 students across six schools in grades 1-5, who were randomized to either receive continuous stretches of cognitive practice, or to a control class period with no such practice. The authors also employed sub-treatments (Math and Games) to further explore effects of continuous cognitive practice (please see the full working paper for more details on their research design), to find the following:
- The act of effortful thinking alone has broad benefits—proxied by improved school performance across unrelated domains. On average, receiving cognitive practice mitigates performance decline in the second half of the test by 21.9%, with similar average effects across the Math arm (21.9%) and Games arm (22%).
- Effortful thinking changes a particular capacity: cognitive endurance. Control students, for example, exhibit significant cognitive fatigue: the probability of getting a given question correct declines by 12% from the beginning to the end of the tests on average.
The authors stress that their findings do not preclude the possibility that their treatments may have benefits through channels other than cognitive endurance that are not studied in this work. Even so, they view their two main sets of findings as offering complementary evidence on the potential link between schooling and generalized mental capacity. And those benefits likely extend beyond school. For example, the authors also document substantial performance declines among full-time data entry workers and among voters at the ballot box, with more severe declines among more disadvantaged populations. While only suggestive, the patterns provide impetus for additional work on cognitive endurance.
-
Studies have revealed a correlation between parents’ involvement in their children’s education (through event attendance, volunteering, communication with teachers, etc.) and better school performance, with some research showing a causal relationship. Likewise, publicly supported preschools such as Head Start are required to promote family engagement, which means spending limited financial and human resources. Even so, parental attendance at preschool-sponsored parent engagement events is low, raising questions about the effectiveness—and opportunity costs—of such efforts.

Are there ways to improve low participation rates? In this new research, the authors test whether combining financial incentives and behavioral tools could help increase parental engagement, and to do so they employ a randomized control trial (RCT) to test the combined impact of loss-framed financial incentives along with text-message reminders. Before describing their methodology further, a brief word about RCTs and loss-framed incentives. RCTs are a study design whereby people are randomly assigned to a control group (no incentive, in this case) or a treatment group (those who receive the incentive). A well-designed RCT ensures that differences in outcomes are attributable to the variable under study. In this study, that variable is a loss-framed incentive, which is one that is “prepaid” and then “clawed back” if targets are not met. For example, a parent offers $7 at the end of the week if a child does the dishes every night, but then deducts $1 for every night the child misses.
In practice, the authors’ treatment group included 319 parents at preschool-sponsored family engagement events at six subsidized preschools in Chicago from November 2018 to March 2019. Treatment parents were offered $25 per event for eight roughly 90-minute events, a compensation level slightly above the median hourly wage of parents in this demographic. The monetary incentive was offered as a loss-frame incentive of $200 in a virtual account (redeemable at the end of the experiment), of which $25 was deducted for each missed event. The parents also received weekly text message reminders with event details, as well as a second text message that indicated how much money remained in their account.
The authors’ findings include the following:
- Financial incentives and reminders increased the attendance rate by 28% (3.6 percentage points), from 12.9% to 16.5%.
- The length of the event, or the time of day that it was held, had no statistically significant effect on participation.
- A key positive spillover also occurred: Consistent with habit formation, treatment parents were more likely to attend events that were not incentivized.
The good news, then, is that the treatment effect is high in relative terms—increasing attendance by nearly a third is a positive result. Unfortunately, at 16.5%, the overall attendance rate is still small and far below expectations. This outcome, combined with other recent research, leads the authors to a blunt conclusion: Preschools serving disadvantaged children should abandon or wholly reimagine their efforts to induce parents to attend school events.
What would a reimagined effort look like? Given such barriers to attendance as work schedules and low parental expectations on the value of such events, such programs may need to offer substantially more money than merely compensating for lost earnings. Also, schools may have to offer events that parents perceive as worthwhile, and future research could employ randomization tests to better understand parents’ preferences.
-
Governments often provide important services like health care, education, or retirement savings. In some settings, they do so directly, competing with private providers, while in other settings, they subsidize private providers. In either case, economists and policymakers typically assume that consumers care only about the characteristics of the service, not about whether the government is involved in its provision.
What changes if some consumers are ideologically opposed to government intervention, and thus select out of products with government involvement? These choices can have important consequences for market conditions: because government involvement typically occurs in markets with important externalities, consumer choices can ultimately affect the total cost of the program, prices, levels of government spending, and overall welfare.

To study this phenomenon, the authors analyze consumer response to the Patient Protection and Affordable Care Act of 2010 (ACA), popularly known as “Obamacare.” The ACA was one of the most significant and politically divisive expansions of the US federal government in decades. The law passed on party lines in 2010, and as late as 2019 the political divide remained among consumers: 80% of Democrats held a favorable view of the ACA, compared to only 20% of Republicans. If partisanship induces some of the intended beneficiaries (that is, uninsured, low-income Republicans) to opt out of the government-sponsored ACA marketplaces, then the political enrollment decisions pose an obstacle to the primary ACA goal of achieving near-universal insurance coverage. Further, if healthy consumers opt out, this “political adverse selection” implies an increase in insurers’ average costs, which then translates to higher premiums and larger per-enrollee subsidy outlays.
The authors examine enrollment data and develop a model of political adverse selection to find the following:
- Controlling for demographics, health status, and supply-side factors, the authors find that Republicans were significantly less likely to enroll in ACA marketplace insurance plans than independents and Democrats.
- This difference is driven by healthy Republicans: While unhealthy Republicans were 4 percentage points less likely to enroll than unhealthy independents and Democrats, healthy Republicans were 12 percentage points less likely to enroll than healthy independents and Democrats. Political enrollment decisions thus worsened risk selection into the marketplaces.
- Political adverse selection led to a 2.7% increase in average cost; these higher costs translate to higher premiums for high-income households and higher subsidies to low-income households.
- Finally, political adverse selection increased the level of public spending necessary to provide subsidies to low-income enrollees by around
$105 per enrollee per year.
Beyond the ACA, this work foreshadows a future in which the effectiveness of public policy is increasingly undermined by political behavior and political narratives, especially including settings where individuals’ engagement with government programs generates externalities, such as vaccination campaigns or public education.
-
Satoshi Nakamoto, the creator of Bitcoin, invented a new form of trust without the need for the rule of laws, reputations, relationships, collateral, or trusted intermediaries that govern mainstream financial systems. Nakamoto did this by combining ideas from computer science and economics to incentivize a large, anonymous, decentralized, freely entering and exiting mass of compute power around the world to collectively monitor and maintain a common data set, and thus enabling trust in this data set. The specific data structure maintained by this large mass of compute power is called a blockchain.
This paper argues that while this new trust is clearly ingenious, it suffers from a pick-your-poison conundrum with two possible outcomes: Either this new form of trust is extremely expensive relative to its economic usefulness, or it is vulnerable to collapse. On the first count—the high cost of this new trust—Budish presents three equations. Very broadly summarized, the first equation says that the dollar amount of compute power devoted to maintaining trust is equal to the dollar value of compensation to miners. For a sense of magnitudes, in 2022 through early June, this compensation has averaged about $250,000 per block of data, or about $40 million per day.
The second equation addresses the key vulnerability to Nakamoto’s form of trust—a “majority attack.” Nakamoto’s method for creating an anonymous, decentralized consensus about the state of a dataset relies on most of the computing power devoted to maintaining the data to behave honestly. In other words, it must not be economically profitable for a potential attacker to acquire a 51% majority (or greater) of the compute power. The cost of such an attack must exceed the benefits of an attack.
Before describing the third equation, let’s pause to consider the terms “stock” and “flow,” which economists use when describing variables like, say, a bank balance at a particular point in time (stock), vs. the amount of interest earned over time (flow). In this case, the recurring payments to miners to maintain honest compute power is a flow (as in equation one), while the value of attacking the system at any given time is a stock (equation two). To illustrate, imagine a Main Street bank that must secure the money in the building on any given day. The daily wages of the security guards protecting the bank are a flow, and the money in the bank on any given day is the stock.
The third equation, then, tells us that the flow-like costs of maintaining trust must exceed the stock-like value of breaking the trust. The key to understanding this trust is that it is memoryless, which means that Nakamoto’s trust is only as secure as the amount of compute power devoted to maintaining it during a given unit of time. Likewise, a big attack at a low-secure moment puts Bitcoin at jeopardy.
One way to understand this idea of memoryless trust is to consider the amount of security that your bank provides for your financial accounts on a given day, let’s call it Wednesday. You benefit from all the security features implemented by your bank in the previous days, weeks, months, and years—as well as from laws, regulations, and reputational incentives—and that security stays in place 24/7. You should be no more worried about your accounts on Wednesday as you were on Tuesday, or you will be on Thursday, and so on.
Nakamoto’s system of trust has no built-in “memory,” but is only as good as the amount of compute power dedicated to maintaining that trust on that Wednesday, and then again on Thursday, and so on. Each day starts anew. If this were the case for your bank, it would mean that its daily security budget would have to be large relative to the whole value of attacking it. Again: the flow-like costs of maintaining trust must exceed the stock-like value of breaking the trust. Moreover, the costs for Nakamoto’s system of trust scale linearly, so if an attack becomes 1,000 times more attractive, that means 1,000 times more compute power must be spent to secure trust. Or, to return to our Main Street bank example, if there is suddenly 1,000 times more money in the bank, bank management would need 1,000 times more security guards. As Budish bluntly states: “This is a very expensive form of trust!”
Regarding Budish’s second poison—the system’s vulnerability to collapse—let us first consider the nature of the computers that secure trust in Bitcoin. These are not ordinary computers (as Nakamoto first envisioned), like the ones on our desks and laps, but rather machines with highly specialized chips that are dedicated to Bitcoin mining. They are very good at this task, they operate quickly, and they are essentially useless for any other function. Likewise, if an attack causes collapse of the system, it will render those machines nearly worthless.
This recasts the attacker cost model: In addition to charging the attacker the flow cost, the attacker must also be charged for the decline in the value of their specialized capital, which makes the attacker’s cost more like a stock (expensive!) than a flow (much cheaper), and thus makes the blockchain more secure.
So, if this attacker cost model is correct in describing why Bitcoin has not yet been majority attacked, then what changes to the environment could cause incentives to flip and lead to a majority attack? Budish’s analysis yields three main attack scenarios, with the first two describing instances when the cost of an attack changes from an expensive stock cost to a relatively cheaper flow cost. First, changes could occur in the market for the specific technology used for Bitcoin mining; for example, a chip glut, including for previous generation “good enough” chips, would make attack costs more like a flow than a stock.
Second, a large enough fall in the rewards to mining due to a decline in either the value of Bitcoin or the number of Bitcoins awarded to successful miners would lead to mothballing a large amount of specialized mining equipment. If more than 50 percent of capital is mothballed for a sufficiently long period of time, this would raise the vulnerability to attack on two counts: Economically, the opportunity cost of using otherwise-mothballed equipment to attack is very low; and logistically, large amounts of mothballed equipment might make an attack easier to execute. This, again, would make the opportunity cost of attack more like a flow than a stock. And third, Budish describes a scenario with a large increase in the economic usefulness of Bitcoin, (without a commensurate increase in the rewards to miners), thus incentivizing an attack.
Bottom line: the cost of securing the blockchain system against attacks can be interpreted as an implicit tax on using Nakamoto’s anonymous, decentralized trust, with the level of the tax in dollar terms scaling linearly with the level of security. Numerical calculations suggest that this tax could be significant and preclude many kinds of transactions from being economically realistic.
-
Recent proposals in the United States to increase the federal minimum wage from its current level of $7.25 (per hour) to at least $15 would impact a large fraction of the US workforce. About 40% of non-college-educated workers and 10% of college-educated workers currently earn a wage lower than $15. However, not all workers within those education groups would experience a wage increase in the same way. For example, as the accompanying figure illustrates, a $15 minimum wage would nearly double the wages of workers in the bottom 20% of the non-college wage distribution but would not bind on workers in the top 60%. The variation in wages within an education group is an order of magnitude larger than the variation in wages across education groups.

This substantial heterogeneity in wages raises an important question: What is the extent to which firms will substitute away from those workers who benefit from the large minimum wage? Existing research implies a low elasticity of substitution across workers in the short run; in other words, firms cannot quickly find other means of production (by, say, replacing humans with machines or replacing low-skilled workers with more productive workers) and therefore must pay workers the higher minimum wage.
But the short run is not the whole story—a study of the distributional impact of the minimum wage across workers must distinguish between short- and long-run effects. The authors address this challenge by developing a framework to assess the distributional impact of the minimum wage over time. Broadly described, this novel framework includes features that reflect the effects of a minimum wage increase on the US economy in the short and long run, including a large sampling of jobs and a low degree of substitutability among inputs in the short run, as well as monopsony power in labor markets (or when one or a few firms face little competition for labor). Their main findings include:
- A permanent increase in the minimum wage to $15 has beneficial effects on low-earning workers in the short run, when even a sizable increase in the minimum wage induces only a small adjustment in the employment of workers who initially earn less than the new minimum wage. Hence, an increase in the minimum wage leads to an increase in labor income and welfare for such workers.
- In the long run, though, firms slowly reorganize their production and start substituting away from such workers by, for example, gradually hiring more higher-skilled workers for whom the minimum wage does not bind and fewer of those for whom it does.
- The resulting welfare of such workers in response to large changes in the minimum wage needs to account for both the short-run benefits and the long-run costs.
- The authors show that other policies, such as an expansion of the Earned Income Tax Credit (EITC), which distributes funds to workers based on income and number of children, are more effective than the minimum wage in terms of helping lower-income workers in the long run.
- All that said, there is a role for a minimum wage. The authors find that a modest minimum wage of about $9, which serves as a complement to the EITC, performs much better than either a minimum wage policy on its own, or an EITC policy on its own.
Bottom line for those hoping to improve the welfare of low-wage workers: Combine a modest minimum wage with a progressive tax-transfer scheme, such as the EITC, as opposed to a large increase in the minimum wage that may prove beneficial in the short run, but that effectively prices workers out of the market in the long run.
-
The explosion of data available to screen and score borrowers over the past half century has also raised important questions about whether to allow lenders to price that data. Put another way, to what degree should lenders be able to vary prices of their products, like home and auto loans, based on a consumers’ previous borrowing experience?

To examine this question, the authors construct a methodology to measure the welfare effects of increased data availability by treating changes in data availability as a form of third-degree price discrimination (or when companies charge different product prices to different consumers). They then apply this framework to a commonly studied event that leads to information removal under the Fair Credit Reporting Act (FCRA), which requires that flags indicating the occurrence of consumer bankruptcy be removed after seven (10) years for a Chapter 13 (Chapter 7) bankruptcy. Using administrative data from TransUnion and focusing on auto lending, the authors find the following:
- Broadly, flag removal leads to discontinuous increases in credit scores, a corresponding drop in interest rates on new loans, and an increase in loan volume.
- Regarding social welfare loss and transfers in auto lending, the authors find that flag removal results in a 17-point increase in credit scores, a 22.6 basis point reduction in interest rates, and an $18 increase in borrowing.
- Bankruptcy flag removals transfer approximately $19 million to previously bankrupt consumers each year, at the cost of roughly $598,000 in social welfare. Thus, for each dollar of surplus transferred to previously bankrupt consumers, only $0.03 of social surplus is destroyed.
Bottom line: While flag removal is costly for social surplus, the distributional effects of flag removal are much larger than their impact on social welfare. This work suggests that flag removal is a relatively inexpensive way, in terms of social efficiency, to transfer surplus to previously bankrupt consumers. Finally, by providing a novel framework for studying the role of data acquisition in consumer credit markets, this work shows that prices and borrowing changes resulting from new data are sufficient statistics for welfare analysis; importantly, this framework is applicable to other lending markets.
-
While it is uncontroversial that partisanship drives personal policy preferences, relatively little is known about partisanship’s impact on market decisions. This paper examines whether partisanship influences the labor market. The authors leverage new administrative data on the political affiliation of business owners and private-sector workers in Brazil, a field experiment, and an original large-scale survey sampling both workers and owners within the administrative data to both quantify partisanship as a determinant in worker-firm sorting and within-firm careers, as well as to isolate the role of political discrimination in hiring.

In particular, the authors study the complete Brazilian formal labor market from 2002 to 2019, which allowed them to build a novel dataset including the identities of business owners and the political affiliation of nearly 12 million owners and workers (11.4% and 7.8% of all private-sector owners and workers in the sample, respectively). This dataset allows the authors to observe partisan affiliation for the entire formal economy over a long period, to control for a wide set of observable characteristics (such as workers’ and owners’ demographics, location, industry, and occupation), and to precisely benchmark their estimates of the role of politics.
Overall, the authors’ key finding reveals that individual political views have real implications for hiring and management practices of private-sector firms, and the magnitude of these effects is large: shared partisan affiliation is a stronger driver of assortative matching between firms and workers than shared gender or race.
The authors further isolate the role of political discrimination in hiring to find the following:- Assortative matching is higher the higher the on-the-job personal interactions.
- There is a sharp change in the political composition of the workforce when an owner switches parties: In line with an owner’s change in political preferences, there is a sharp increase in hiring probability for workers of the owner’s new party and a sharp decrease for workers of the old party.
- The authors also conduct a field experiment in which owners evaluate synthetic resumes containing political signals to reveal that owners prefer co-partisan workers over workers from a different party—all else equal.
- The authors survey both sides of the labor market to find a consensus among business owners and workers that political discrimination does play a role in firms’ choices.
- Finally, the authors also show that political discrimination not only affects the sorting of workers and firms, but it also has additional real economic consequences: co-partisan workers are paid more and are promoted faster within the firm, despite being less qualified; firms displaying stronger degrees of political assortative matching grow less than comparable firms.
This work reveals trends in political polarization that may reshape how we think about organizational structures and firm behavior. On the other hand, the substantial degree of segregation along political lines in the labor market might have important implications for political polarization itself. Also, this work suggests that workplaces may contribute to the emergence of political echo chambers.
The authors stress that while their findings raise the possibility that business owners might be willing to trade-off firm growth to have a workforce of individuals with similar political views, their evidence remains suggestive. Also, while a key objective of the paper is to isolate the importance of political discrimination, the authors acknowledge that other mechanisms, such as overlapping political and nonpolitical networks, likely contribute to the magnitudes that they establish about the relevance of partisanship in driving the sorting of workers across firms.
-
Government participation in the economy, via direct or indirect ownership of private sector firms, is pervasive around the world and is often characterized by two distinct models: the “grabbing hand” model, commonly used to describe Russia and Eastern Europe in the 1990s, where government interference by bureaucrats and politicians represents a key friction to the growth of private businesses; and the “helping hand” model where the government helps private sector firms overcome market failures.
The authors bring these models to an investigation of China’s massive and high-growth economy to determine whether market participants view the government as a grabbing or helping hand, in the context of the multi-trillion-dollar venture capital and private equity (VCPE) market. They combine a field experiment with new administrative and survey data to ask whether—all else equal—firms prefer to receive capital from the government vis-à-vis private investors. Specifically, the authors focus on the matching between capital investors, or Limited Partners (LPs), and profit-seeking firms, that is, the fund managers or General Partners (GPs), that manage invested capital by deploying it to high-growth entrepreneurs.

The authors characterize the role of government in the Chinese VCPE market by matching data on VCPE investments from 2015–2019 with administrative business registration records, through which they can observe the ownership structure of all firms (GPs) and investors (LPs) in the data, to establish four descriptive facts:
- The government—represented by central, provincial, and local government agencies as well as state-owned enterprises (SOEs)—is the leading investor, with the government as a majority owner of about half of LPs, and government LPs significantly larger investors than private LPs.
- The government is also a minority owner of a significant share (about a third) of GPs.
- Government-owned GPs perform worse than private GPs.
- There is a pattern of assortative matching, with government LPs investing disproportionally more in government-owned GPs.
These facts, while informative, can support many different interpretations, which motivates the authors to estimate actual firm demand for government capital. To do so, they conduct a field experiment in 2019 in collaboration with the leading VCPE industry service provider in China. This collaboration led to an experimental survey of 688 leading GPs in the market (with a response rate of 43 percent), which together manage nearly $1 trillion. GPs are asked to rate 20 profiles of LPs along two main dimensions: (i) how interested they would be in establishing an investment relationship with the LP (under the assumption the LP is interested); and (ii) the likelihood that the LP would be interested in entering an investment relationship with them if they had the chance. Importantly, there is no deception in this survey because GPs know the LP profiles are hypothetical. (Please see the working paper for more details on the survey instrument.)
The authors’ novel experimental survey finds the following:
- The negatives of receiving capital that is tied to the government outweigh the positive value GPs may obtain from establishing a link to a government-related politically connected investor.
- This finding is consistent with a “grabbing hand” interpretation of the government’s involvement in the market.
- Using both the administrative micro-data and follow-up surveys, and consistent with several anonymous discussions with active VCPE firms, the authors find support for an explanation according to which government connections of the investors lead to interference in decision-making that is due to political, rather than profit-maximizing, incentives.
This work has several implications. On the one hand, by providing direct evidence of the private sector perspective of the advantages and disadvantages of government investors, this research deepens our understanding of the nature of China’s model of economic growth grounded on the dominance of state economic actors. On the other hand, this work makes the simple point that the demand for government capital differs across different types of firms. As a result, to the extent that how capital is allocated depends on the agents receiving it, understanding the demand side is important to fully capture the efficiency implications of government participation, an aspect of the debate that the authors believe has been largely neglected but that is crucial for both theory and policy.
-
Despite widespread concern about homelessness, many of the most basic questions about America’s unhoused population, including its size and composition, are unresolved. Relatedly, the extent to which the Decennial Census and Census Bureau surveys include those experiencing homelessness is unclear in documentation and reports, and the empirical scope of coverage has not been examined. This paper compares three restricted use data sources that have been largely unused to study homelessness to less detailed public data at the national, local, and person level. This triangulation process helps the authors address the difficulty in counting a population without fixed domiciles and who may otherwise actively avoid Census authorities.
Before describing the authors’ findings, a note about their three data sources. The authors draw on restricted microdata from the 2010 Census, the American Community Survey (ACS), and Homeless Management Information System (HMIS) databases from Los Angeles and Houston. The ACS and HMIS include people in homeless shelters, while the Census includes both sheltered and unsheltered homeless people. The authors compare these data sources to each other, along with data from the Department of Housing and Urban Development (HUD)’s widely cited and influential point-in-time (PIT) count (an annual assessment of sheltered and unsheltered people experiencing homelessness at one moment in time).

They find the following:
- On any given night, there are about 500,000-600,000 people experiencing homelessness in the United States, with about one-third sleeping on the streets and the rest in shelters.
- Most homeless individuals were included in the 2010 Census, but they were often counted as housed or in group quarters, a fact that likely reflects this population’s frequent transitions between housing statuses and tenuous attachment to the living quarters of family and acquaintances.
- Importantly, a substantial number were counted twice, which has implications for the coverage of homeless individuals in other surveys that are not intended to represent the homeless population. Given this double-counting, the authors suggest that homeless individuals may be included in surveyed households’ responses more often than previously thought.
This work deepens understanding of the mobility and persistent material deprivation of the US homeless population and lays the foundation for future pathbreaking work to investigate the characteristics, income and program receipt, mortality, housing transitions, and migration patterns of this difficult-to-study population.
-
A growing literature documents a large increase in polarization across political parties in the US, meaning that your affiliation with a political party is now a more significant predictor of your fundamental political values than any other social or demographic divide. This polarization has extended to social groups, including family, friends, and neighborhoods, and raises important questions about the workplace. How, for example, has political polarization changed in the workplace over time, and does it affect firm value?

To this point, little is known about the effect of political polarization in the workplace, especially regarding firm value. To fill this gap, the authors study political polarization among members of executive teams by reviewing SEC disclosures, which allow them to link executives to voter registration records and obtain party affiliations. Recent research reveals how political partisanship shapes the perception of the economy and economic decisions not only by households, but also by economically sophisticated agents in high-stakes environments. The authors combine data from the SEC with voter registration records to find the following:
- Executive teams became more partisan between 2008 and 2020, with partisanship defined as the degree to which a single party dominates political views within the same executive team.
- Specifically, the authors measure the partisanship of executive teams as the probability that two randomly drawn executives from the same team are affiliated with the same political party. Based on this measure, they find a 7.7-percentage-point increase in the average partisanship of executive teams.
- The rise in partisanship is explained by both an increasing share of Republican executives and, to a larger degree, by increased matching of executives with politically like-minded individuals.
- Finally, by studying stock price reactions to executive departures, the authors show that departures of executives who are misaligned with the political views of the team’s majority are more costly for shareholders than departures of politically aligned executives. Hence, some aspects of the rising polarization among US executives have negative consequences for firms’ shareholders.
The authors acknowledge that important questions remain regarding the underlying mechanisms between political polarization and reduced firm value. How, for example, does the political diversity of the executive team affect corporate decisions, such as hiring, investment, and financing policies, as well as corporate innovation decisions? How does the rising political polarization of executives influence other stakeholders, including debt holders, employees, and local communities? Is political assortative matching among executives special among firm employees? And, to what extent are partisan executives motivated directly by political preferences (i.e., wanting to live and work around like-minded individuals) or indirectly (e.g., by selecting on characteristics of the company, its workforce, or its location that are correlated with partisanship)?
-
People can only do so much. When confronted with scarcity, including money or friendships among other concerns, people naturally tend to focus on those shortages, which can lead to inattention to other important matters. For parents struggling to meet such shortfalls, this inattention can redound to their children. More broadly, this “scarcity mindset” can lead to poor decision-making on actions with long-term consequences, thus perpetuating a “scarcity trap.”

To examine this phenomenon, the authors focus on two types of scarcity relevant to the COVID-19 pandemic in the lives of parents with young children: financial scarcity, subjectively defined as insufficient funds at the end of the month to meet basic needs; and social scarcity, or people’s subjective sense of loneliness. The authors examine data collected from low-income parents of preschool-age children and from the directors of those children’s preschool centers, which closed March 17, 2020, due to a statewide stay-at-home order.
In particular, the authors study the degree to which parents were aware of information they received from the preschool centers, which the authors analyze vis a vis parents’ reports of financial scarcity and loneliness, to find the following:
- Financial and social connections scarcity are significantly positively associated with inattention.
- Further, financial scarcity and loneliness are largely independent phenomena and have roughly equivalent impacts on inattention.
- Specifically, parents who report a financial or social scarcity mindset are 63 percent more likely than their counterparts to be inattentive to information that was sent by the schools about resources to help them during the COVID-19 pandemic.
This work contributes to the nascent body of literature that highlights the role of resource scarcity in individuals’ cognitive attention. For example, a large literature discusses why people fail to act on information even when they attend to it because of present bias and other cognitive biases. However, if people do not even attend to information (as it was provided) when they are experiencing scarcity, suboptimal behavioral choice will remain a problem. The authors acknowledge that information alone is rarely enough to motivate behavior change, but information is often a key first step, and understanding people’s mindsets is important in effecting change.
-
The recent inflation surge caught many businesses and policy makers flat-footed. US consumer prices rose 8.6 percent over the 12 months ending May 2022, a jump of several percentage points relative to previous years. Nominal wage growth failed to keep pace. After adjusting for CPI inflation, real average hourly earnings in the US private sector fell 3 percent over the 12-month period ending May 2022.

Some economists have argued that this development intensifies inflation pressures as workers, having experienced a material drop in purchasing power, will bargain for a bigger boost in wages to make them whole. Employers will then accommodate the desire for wage catchup, especially when faced with tight labor markets. The resultant faster wage growth will raise production costs and feed into higher price inflation. For policy makers, a bigger wage-catchup effect implies the need for tighter monetary policy to bring the inflation rate down to a desired level, raising the likelihood of recession.
However, this argument misses a key point: the pandemic-induced shift to remote work is a positive shock to the amenity value of work, meaning that US workers are likely willing to trade off some wage gains to work from home. How strong is this wage-growth restraint on inflation?

To answer this question, the authors develop novel survey evidence to test the mechanism, quantify its force, and draw out its implication. They find the following:
- Looking back 12 months from April/May 2022, about four-in-ten firms say they expanded opportunities to work from home or other remote location to keep employees happy or moderate wage-growth pressures. Looking forward, a similar number expect to do so in the coming year. Thus, the authors find clear evidence that the wage-growth restraint mechanism associated with the rise of remote work is operating in the US economy.
- When firms say they are expanding remote work options to restrain wage growth pressures, the authors ask how much wage-growth moderation they achieve? Aggregating over all the responses, including firms that are not using remote work to restrain wage growth, the survey data imply a cumulative wage-growth moderation of 2 percentage points over two years centered on April/May 2022. This wage-growth moderation shrinks the real-wage catchup effect on near-term inflation pressures by more than half.
- Bottom line: the recent rise of remote work materially lessens wage-growth pressures, easing the challenge confronting monetary policy makers.
In concluding, the authors remark that their evidence and analysis do not argue for complacency about the inflation outlook; rather, they imply only that the challenge is modestly less daunting than it might seem.
-
Economists have long explored the social phenomenon known as homophily, or the tendency to associate with those who share similar traits, even if such an inclination is costly. Like attracts like, it seems, but is that always the case? Gary Becker’s seminal 1957 book, The Economics of Discrimination, laid the groundwork for thinking about this phenomenon by developing theories of taste-based discrimination. However, even after decades of research, important questions remain.
This paper studies whether homophily by gender is driven by preferences for shared traits within the context of mentorship, a setting where—unlike hiring or lending or renting—explicitly using race, gender, and nationality to determine matches is common, encouraged, and even considered best practice. Among the top 50 US News college/universities, all but two host a mentorship program designed specifically for women in STEM fields, and 80% of the programs match students with a same-gender mentor. Do mentees value same-gender mentors? Or does demand for same-gender mentors arise from a lack of information on mentor quality?

Using novel administrative data from an online college students/alumni mentoring platform serving eight colleges and universities, the authors find the following:
- Female students are 36 percent more likely to reach out to female mentors relative to male students, conditional on various observable characteristics including student major, alumni major, and alumni occupation.
- This propensity to reach out to female mentors may come at a cost: female mentors are 12 percent less likely than male mentors to respond to messages sent by female students.
These findings are consistent with taste-based discrimination, that is, female students incurring a cost to access a female mentor. But what if researchers cannot control for all mentor attributes used in students’ decisions? Students, for example, could use information outside of the mentoring platform to decide whom to contact, leading to omitted variable bias. To address this, the authors designed a survey that incentivizes truthful responses, and they find the following:
- Female students strongly prefer female mentors, while male students exhibit a weak preference for male mentors.
- Further, using the trade-offs students make between mentor gender and other mentor attributes, the authors estimate that female students are willing to give up access to a mentor with their preferred occupation to match with a mentor of the same gender.
The authors then investigate whether female students’ preference for female mentors reflects taste-based discrimination, which could arise from female students’ affinity for interacting with women, or from valuing an attribute that only female mentors possess, to find:
- Female students are only willing to pay for female mentors when there is no information on mentor quality.
- In the basic profile condition, female students are willing to trade off a mentor with their preferred occupation to access a female mentor. In the ratings condition, the authors find that this willingness to pay declines to zero. In other words, when information on mentor quality is available, female students are unwilling to trade off any dimension of mentor quality to access a female mentor.
- The authors also find no evidence that female students’ preferences for mentor quality differ from that of male students. All students—male and female—value the attributes described in the ratings, particularly a mentor’s knowledge of job opportunities.
- Finally, the authors’ survey reveals that female students believe that female mentors are more friendly/approachable than male mentors, which, among other explanations, may describe female students’ preference for female mentors. Regardless, this work reveals that gender is valued for its information content and direct provision of that information would reduce students’ valuations of mentor gender.
This work has several important implications, including regarding employee recruitment initiatives, service-provider matching, and doctor-patient matching that commonly use shared traits as a coarse proxy for match quality. These efforts may be well-intentioned, but they could also lead to efficiency losses relative to those that incorporate information on valued traits into the matching process.
-
Discussions about how to best address the incidence of violent crime usually revolve around questions pertaining to policing (more cops, fewer cops, or different types of cops?) and incarceration (to what degree is prison effective, and for whom?). In recent years, though, cognitive behavioral therapy (CBT) programs have emerged as promising alternatives to policing and incarceration. However, one key question has persisted: How long do CBT benefits persist?
Before describing how this new research answers that question, a word about CBT and its use in crime prevention programs. CBT is a type of psychotherapy in which negative patterns of thought about the self and the world are challenged to alter unwanted behavior patterns or to treat mood disorders. In the case of criminal justice settings, CBT can address many issues, including means-ends problem solving, critical and moral reasoning, cognitive style, self-control, impulse management, among others.1 In terms of violent crime, and as described in this paper, people may react in haste, fail to consider the long run consequences of their actions, or overlook alternative solutions to their problems. They may also cling to exaggerated, negative beliefs about a rival. By making people conscious of these and other thoughts, and by offering methods to deal with them, CBT can affect behavior.

Until now, research on the efficacy of CBT has typically extended from several months to two years, with results suggesting that CBT effects may be short-lived. This new working paper offers an analysis based on 10 years by returning to a Liberian study initially conducted between 2009 and 2011. The men in the program were engaged in some form of crime or violence, ranging from street fighting to drug dealing, petty theft, and armed robbery. In addition to therapy, a quarter of the nearly 1,000 men received a $200 cash grant.
After one year, the men who received therapy plus cash had reduced their crime and violence by about half, but did those effects hold over the longer term? To answer this question, the authors reviewed four arms, or men who were given particular treatment: Therapy Only, Cash Only, Therapy+Cash, and a Control Condition.
Ten years after the interventions, the authors found and resurveyed the original sample, reaching 833 of the original 999 men (103 had died in the intervening years), or 93% of the survivors, to find that behavior changes can last, especially when therapy is combined with even temporary economic assistance. For example, 10% of the control group was engaged in drug selling, and that fell to about 5% in the Therapy+Cash group. Also, compared to the control group, the Therapy+Cash group committed about 34 fewer crimes per year on average over 10 years—again, about half the level of the control group.
Why does cash matter? Receiving cash was akin to an extension of therapy, in that it provided more time for the men to practice independently and to reinforce their changed skills, identity, and behaviors. After eight weeks of therapy the grant helped some men to avoid homelessness, to feed themselves, and to continue to dress decently. Thus, they had no immediate financial need to return to crime. The men could also do something consistent with their new identity and skills: execute plans for a business. This was a source of practice and reinforcement of their new skills and identity.
These are important results, and this approach holds promise beyond West Africa. Indeed, cities around the world have begun to mimic the Therapy+Economic Assistance approach. However, the authors note that more research is needed to better understand what can lead CBT-induced behavior change to endure.
1National Institute of Justice/US Dept. of Justice, “Preventing Future Crime with Cognitive Behavioral Therapy.”
-
It is understood that individuals can mitigate the negative effects of CO2 emissions on the earth’s climate by the lifestyle choices they make and by their support of emissions-reducing policies. However, little is known about what shapes a person’s views about climate change. Do people change their behavior in response to certain information? And what happens if the same information is presented with different framing? Does such framing influence a person’s views and, ultimately, affect her behavior? What price is she willing to pay to reduce CO2 emissions?

These and similar questions motivate this new working paper, which studies how information on carbon emission reduction influences participants’ willingness to pay (WTP) for voluntary offsetting CO2 emissions. The authors’ analysis is based on a large representative survey of the German population, to whom they provide information on ways to reduce individual CO2 emissions. Broadly described, individuals were assigned to four treatment groups and one control group. The treatment groups received identical, truthful information on ways individuals may reduce CO2 emissions, but they varied the framing of the treatments, with two groups receiving information framed as scientific research, and two groups receiving information on the behavior of people like them. The authors then determined individuals’ willingness to purchase carbon offsets both before and after receiving the information. Their findings include the following:
- Providing information on actions to fight climate change increases individuals’ WTP for voluntary carbon offsetting by €15 compared to the change in the control group, which corresponds to about one-third of the overall increase in WTP for carbon offsetting.
- Framing matters: Peer framing increases the WTP on average by €18, whereas the scientific framing increases the average WTP by €12. Within the scientific framing, the government framing increases WTP by about €3 more than the general research framing, but little variation exists within the peer framing.
- Older survey participants and those with a secondary school certificate, but no tertiary education, are most responsive to the provided signal; women also react strongly.
- Participants that were ex ante more positively disposed toward taking actions to fight climate change display a larger reaction to information treatments. Specifically, individuals with a higher prior WTP, a higher degree of climate concerns, and those with a strong environmental stance are more responsive.
- Regarding politics, supporters of a center-right (CDU/ CSU) and far right (AfD) party do not react at all to information treatments. Supporters of a center-left party (SPD) increase their WTP by more than €30 in response to the information treatments. The treatment effect for supporters of the Green party is similar in magnitude but only marginally significant.
- A follow-up survey of the endogenous information acquisition of individuals finds that individuals choose information that largely aligns with their prior stance toward a topic, while they disregard information that might challenge their existing beliefs.
Bottom Line: This work suggests that information is a powerful tool in persuading people to reduce their carbon footprint. More than just information, though, appealing to internalized personal norms, or invoking adherence to social norms, can be effective in motivating individuals toward more climate-friendly behavior.
-
Exchange-traded funds (ETFs), or baskets of securities that track an underlying index, have grown quickly since their appearance in 1993, reaching $7.2 trillion by the end of 2021 in the US alone, an amount exceeding the total assets of US fixed income mutual funds. Most ETFs track passive indexes, so to manage index deviations, ETFs rely on authorized participants (APs) to conduct arbitrage trades, in which APs create and redeem ETF shares in exchange for baskets of securities called the “creation basket” and the “redemption basket,” respectively. These baskets are chosen by the ETF. (See accompanying Figure.)

This new working paper focuses on how ETFs use creation and redemption baskets to manage their portfolios. By analyzing ETF baskets and their dynamics, the authors gain new insights into the economics of ETFs. One key insight is that, despite their passive image, ETFs are remarkably active in their portfolio management. They often use baskets that deviate substantially from the underlying index and adjust those baskets dynamically.
Before digging deeper into the authors’ findings, it is useful to note two facts. First, ETF baskets include a fair amount of cash. The average creation (redemption) basket contains 4.6% (7.8%) of its assets in cash, based on the baskets pre-announced by the ETF at the start of a trading day. The cash proportions are even larger, 11.6% (8.2%) for creation (redemption) baskets based on realized baskets imputed from ETF holdings. Second, ETF baskets are concentrated—they include only a small subset of the bonds that appear in the underlying index. Both facts are costly to the ETF in terms of index tracking.
The authors build a model that incorporates these facts and highlights ETFs’ dual role of index tracking and liquidity transformation; empirically, the authors focus on US corporate bond ETFs. (Please see the full working paper for details about methodology and modeling). In brief, the authors’ key insights are the following:
- Passive ETFs actively manage their portfolios by balancing index-tracking against liquidity transformation. ETFs update their baskets frequently to steer their portfolios toward the index while maintaining the liquidity of ETF shares.
- When investors sell ETF shares, APs can buy and redeem them; when investors buy ETF shares, APs can create and sell them. By absorbing the trades of ETF investors, APs reduce the price impact of those trades. APs’ arbitrage trading thus makes ETF shares more liquid in the secondary market.
ETFs’ active portfolio management has consequences for the liquidity of the underlying securities. The authors find that a bond’s inclusion in an ETF basket has a significant state-dependent effect on the bond’s liquidity. This effect is positive in normal times but negative in periods of large imbalance between creations and redemptions. For example, the COVID-19 crisis witnessed acute selling pressure in the bond market in spring 2020, which led to net redemptions from bond ETFs, which in turn strained the liquidity of the bonds concentrated in RD baskets. Given the growing role of ETFs in liquidity transformation, future episodes of ETF-induced liquidity strains seem likely. Future research can examine additional consequences of ETFs’ active basket management.
-
The rise of new gig economy platforms like Uber and Lyft has led many observers to assume that self-employment is also increasing. However, major labor force surveys like the Current Population Survey (CPS) show no increase in the self-employment rate since 2000. How can this be? One plausible explanation is that many gig workers do not perceive themselves as contractors; likewise, such work is not well-captured by standard questionnaires.
At first glance, tax records appear to tell a different story. In sharp contrast to trends in the CPS, the percent of individuals reporting self-employment income to the Internal Revenue Service (IRS) on their tax returns rose dramatically between 2000 and 2014. (See Figure 1.) Is the administrative data collected by the IRS detecting a deep change in the labor market that major surveys currently miss? This key question motivates this new research into the gig economy’s impact on labor markets.

To address this phenomenon, the authors draw directly on the IRS information returns issued by firms to self-employed independent contractors (of which online-platform-based, or “gig” workers are a subset) to find:
- Unlike in survey data, the authors find that millions of new workers have entered the gig economy since 2012, representing over 1 percent of the workforce by 2018. This growth comes primarily from new online platforms that were not present before 2012.
- However, most platform workers only make small amounts after expenses that supplement their earnings from traditional jobs. As a result, many platform workers do not report that income on their tax returns at all.
- Why, then, are more taxpayers reporting self-employment income on their tax returns over time? The authors find that changes in strategic reporting behavior play a key role. Unlike in confidential surveys, individuals have strategic incentives when reporting tax filings, and those incentives and reporting decisions may change over time. This is particularly true in the case of self-employment earnings which, unlike employment income, can be purely self-reported without any third-party verification.
- More precisely, the authors find that the rise in self-employment reporting is concentrated among low-wage individuals with children who face negative tax rates on the margin due to refundable tax credits like the Earned Income Tax Credit (EITC).
- Do these increases in reported self-employment among credit-eligible workers reflect a real change in labor supply or a pure reporting response? To answer this, the authors study a natural experiment that quasi-randomly changes eligibility for refundable credits at the end of the tax year—once labor supply decisions are sunk—depending on the precise timing of the births of individual’s first children. They find evidence of a pure reporting response to tax code incentives that is large and has grown over time as knowledge of those incentives has spread.
- When the authors consider counterfactual scenarios in which reporting behavior remained constant at the 2000 level, they find that as much as 59 percent of the increase in self-employment rates since 2000 can be attributed to pure reporting changes. The remaining increase can be explained by observed increases in firm-reported freelance work in the early 2000s and the aging of the workforce.

While the authors caution against trusting trends in administrative data over trends in survey data by default, their work shows that tax data can be a powerful tool for measuring labor-market trends so long as reporting incentives are kept in mind. To that end, the authors’ new self-employment series adjusted for reporting trends, as well as their new series on third-party-reported gig work, should prove valuable to other researchers in this area.
-
Companies merge all the time, whether it’s for market share expansion, diversification, risk reduction, or some combination of these and other factors, with the aim to increase profits. However, companies are not always eager to share the news.
While rules stipulate reporting requirements for certain mergers, many go unreported, or they are reported so late in the process (“midnight mergers”) that antitrust authorities who might otherwise oppose a particular combination have no recourse but to let the new business entity move forward. The merger is already baked into the market cake.

For managers, there are trade-offs to weigh when considering whether or when to report. On the one hand, managers who seek to maximize the wealth of current shareholders typically want to disclose positive news about the company as soon as possible. This argues for openness when it comes to mergers. On the other hand, broadcasting a merger could alert antitrust authorities to a merger that might otherwise have escaped their attention, putting the deal at risk and eliminating any possible shareholder gains.
This new research employs a model and empirical analysis to study the relationship between investor disclosures and antitrust risk in publicly traded companies. In particular, the authors examine whether investor disclosures pose an antitrust risk and whether, as a result, managers withhold news of mergers from investors, especially if those deals involve acquiring a rival. Their model makes the following predictions:
- The share of horizontal mergers (or those where companies occupy the same industry and thus are more likely in direct competition) is lower among transactions that require mandatory investor disclosures.
- Managers find nondisclosure profitable for at least some mergers.
- A higher share of undisclosed mergers than disclosed ones are horizontal.
- The fourth prediction provides an expression for the expected antitrust-related cost of investor disclosures, which are strictly positive.
To test the first prediction, the authors rely on the fact that US public companies must disclose mergers to their investors when the acquisition price is greater than 10% of their assets. They show that the share of horizontal mergers fall sharply at the 10% threshold, consistent with the idea that investor disclosures pose antitrust risk.
The authors take the remaining predictions to a rich dataset that captures the value of all mergers, including an inferred measure of unreported mergers, to find that firms completed over $2.3 trillion of undisclosed mergers between 2002 and 2016, representing almost 80% of all transactions (and about 30% when those transactions are weighted by their value).
This work not only suggests the degree to which research and policymakers underestimate the amount of stealth consolidation, but it also raises important questions for further research, including: What are the consequences of such vast undercounting? From an antitrust perspective, has insufficient enforcement played a more prominent role in the economy than previously believed? From a corporate finance perspective, are the returns to M&A activity greater than once thought? And many more, including the role of private equity investors in acquisitions involving horizontal competitors.
-
All regions of the world do not—and will not—experience the effects of CO2 emissions in the same way. Some will suffer greatly from the resultant climate change, while others may even benefit. These heterogeneous effects mean that different countries will have differing incentives to abide by the 2015 Paris Agreement, a climate change treaty meant to limit global warming below 2°C relative to pre-Industrial levels.
These differing incentives also complicate a classic economic tool to influence behavior: taxes or pricing. Do you want to reduce smoking? Increase cigarette taxes. Do you want to encourage home buying? Provide tax breaks. People respond to incentives, and price is a key incentive. In the case at hand, if you want to reduce carbon emissions to a desired level, tax their output accordingly. However, given the heterogeneous effects of CO2 emissions, what are the incentives to impose carbon taxes across different locations of the world? How are these incentives related to actual pledges in the Paris Agreement? What are the implications of these pledges for aggregate temperatures and the economies of different regions across the globe?

This novel research examines these questions by employing a spatial integrated assessment model that the authors developed in recent work1 to determine a local social cost of carbon (LSCC). This allows the authors to address the challenge of linking heterogeneous climate effects with appropriate local action. Very briefly, the authors find the following:
- Most people would oppose a policy that simply imposes carbon taxes such that the carbon price everywhere is equal to the social cost of carbon. In other words, just as there is no single cost of carbon that applies to every region of the world, there is also no single tax that would appeal to all people.
- Setting carbon taxes to achieve the Paris Agreement’s goals would mean rates that most, if not all, countries would consider exorbitant and untenable, exceeding $200 per ton of CO2 in some scenarios. The authors consider such a policy so unrealistic that they question the feasibility of the 2°C target itself.
- Necessary carbon taxes to achieve Agreement goals would involve very large inter-temporal transfers, or differing effects across generations. Asking people to pay a high price today so someone can reap the benefits at a lower cost in 100 years, in other words, is not an easy political sell. When future generations are valued almost as much as the current one (including the effect on growth), the resulting welfare gains are small, but negative for most of the developed world. They turn positive when the elasticity of substitution between clean energy sources and fossil fuels is larger, or when this substitution is easier.
Bottom line: Increasing the elasticity of substitution between energy sources is essential to making required carbon policy among heterogeneous regions more palatable.
1See bfi.uchicago.edu/working-paper/the-economic-geography-of-global-warming/ for the authors’ 2021 paper, “The Economic Geography of Global Warming,”
along with an interactive global map and Research Brief. -
Interest is growing among monetary authorities to begin promotion of digital currencies, which disincentivize the use of cash and could increase financial inclusion. However, little is known about the potential of cryptocurrencies to become a widely used payment method. This paper studies a unique natural experiment: On September 7th, 2021, El Salvador became the first country to make bitcoin legal tender, which not only established bitcoin as a means of payment for taxes and outstanding debts, but also required businesses to accept bitcoin as a medium of exchange for all transactions.

To ease transition to this new payment system, El Salvador also launched an app, “Chivo Wallet,” which allows users to digitally trade both bitcoin and dollars without transaction fees. As an incentive, citizens who downloaded this app received a $30 bitcoin bonus from the government, a significant amount in this dollarized Central American country with a per capita GDP of $4,131, along with discounts for gas.
Given these and other incentives, to what degree was bitcoin adopted? As El Salvadoran government restricts access to information, this research employs a nationally representative survey to answer this question. The survey, which involves 1,800 households, was conducted via face-to- face interviews to avoid the selection issues that may emerge if the survey conditioned respondents on owning a phone or having internet access. The authors’ findings include the following:
- While most citizens in El Salvador have a cell phone with internet, fewer than 60% of them downloaded Chivo Wallet, and only 20% continued to use the app after spending their $30 sign-up bonus.
- Without the $30 bonus, 75% of the respondents who knew about the app would not have downloaded it.
- Most downloads took place just as Chivo Wallet was launched; 40% of all downloads happened in September 2021, with virtually no downloads in 2022. Likewise, remittances in the first quarter of 2022 were at their lowest point since the app’s launch.
- Five percent of citizens have paid taxes with bitcoin, and despite its legal tender status, only 20% of mostly large firms accept bitcoin, and just 11.4% report having positive sales in bitcoin. Further, 88% of those businesses that report sales in bitcoin transform money from sales in bitcoin into dollars, and do not keep it as bitcoin in Chivo Wallet.
- The fixed cost of technology adoption was high, on average, 0.7% of annual income per capita.

This research should give pause to policymakers advocating for the adoption of digital payment systems. Even after a big governmental push and under favorable circumstances, a digital currency’s viability as a medium of exchange faces big challenges.
-
Economics typically views discrimination as a direct action by an individual. A recruiter, for example, may discriminate against women relative to men with similar resumes when searching for candidates to fill a position. Economic tools are then applied to study this phenomenon and to determine effects on labor, firms, and the broader economy, among many other issues.
However, that is likely not the whole story. Sociologists and computer scientists often look beyond direct discrimination to study systemic factors driving group-based disparities. Systemic discrimination consists, for example, of attitudes, policies, or practices that are part of a social or administrative structure, as well as past or concurrent actions in other domains, that create or perpetuate a position of relative disadvantage for certain groups.

To illustrate the limits of solely focusing on direct discrimination, the authors consider an example based on our discriminating recruiter mentioned above. Imagine that this recruiter gives female candidates lower wage offers than male candidates with identical qualifications; this is direct discrimination. After workers are hired, a manager makes promotion decisions based on performance and salary histories. Unless the manager considers and adjusts for the recruiter’s discrimination, seemingly non-discriminatory (even gender-neutral) promotion rules will lead to worse outcomes for female workers. This is systemic discrimination. In other words, even if the manager does not directly discriminate against female workers conditional on their work histories, female workers will be systemically disadvantaged because they have systematically lower salaries due to past discrimination.
Other examples illustrate how systemic discrimination can emerge due to differences in the precision of information available about different candidates (for example, if Black candidates are hired for a summer internship at a lower rate than white candidates, then they have fewer opportunities to signal their skills for future employment), differences in the interpretability of information (for example, if women are excluded from a medical trial then diagnostic procedures will be optimized for men relative to women), and differences in the opportunity to build human capital (for example, if Black candidates typically attend lower quality schools than white applicants, then they have less opportunity to build skills for future employment).

Per these examples, measures of discrimination that do not include systemic factors are incomplete. To address this gap, this work formalizes a definition of total discrimination and decomposes this measure into direct and systemic components. This decomposition motivates the development of new econometric tools to identify each component. The authors apply these tools to hiring experiments, which show how conventional methods of studying direct discrimination can underestimate total discrimination and mask important heterogeneity in systemic discrimination across different performance levels in practice (see accompanying Figures).
Policymakers take note: The development of robust econometric methods for measuring systemic and total discrimination can be a powerful complement to existing regulatory tools. By enriching policymakers’ understanding of dynamics and heterogeneity within and across different domains, such theoretical and empirical advancements can improve policy making and equity in labor markets, housing, criminal justice, education, healthcare, and other areas.
-
What happens when foreign multinationals move into a country with deep-seated cultural norms that differ from their home country? Economists have long noted the effects on local labor markets when foreign companies hire domestic workers, but little is understood about the behavior of foreign multinationals seeking employees in cultural settings highly distinct from their own. What is the role of these differing cultural norms in explaining foreign firm behavior?

To answer this question, the authors analyze the behavior of multinational firms and workers in Saudi Arabia, a country with historically sizable foreign direct investment (FDI), despite its lack of incentives to particularly draw FDI relative to other countries in the region, and a country with conservative norms related to religion and gender that are reflected in business activities and that affect labor supply. The authors use a novel employer-employee matched dataset of Saudi firms in the private sector that unifies both employer-employee matched data and foreign ownership information for the private sector in Saudi Arabia, to find the following:
- Foreign firms on average become larger in employment size and offer higher wages relative to domestic firms.
- Foreign firms, relative to domestic firms in the same industry, hire a larger share of Saudi workers.
- However, there is no significant difference in female share even though most foreign firms come from countries with higher female labor force participation (FLFP) rates.
Regarding wages, the authors find:
- Foreign firms pay a premium of 9% for Saudi workers and 16% for non-Saudi workers.
- Premiums are slightly higher for high-wage Saudis but slightly lower for high-wage
non-Saudis. - Notably, premiums for non-Saudis are higher than those for Saudis regardless of the wage group to which they belong.
Combined with the results in worker shares, the authors document that foreign firms pay a lower premium to Saudis while hiring a larger share of them. These results contrast with past research on foreign firm effects, which has found a positive correlation between relative wage and relative labor: more productive foreign firms pay a higher premium to high-skill workers and hire a larger share of them relative to domestic firms.
The authors rationalize these results using a simple model in which foreign and domestic firms differ in their productivity levels and amenities offered to each type of worker. The authors emphasize amenities to be the non-wage job characteristics that are influenced by deep-seated cultural norms, such as gender-segregated workplaces for both men and women workers and flexible work schedules during daily prayer, Muslim holidays, and fasting season. The authors find that amenities are important in understanding foreign firms’ wage setting and worker hiring decisions in settings with differing deep-seated cultural norms.
-
Saudi female labor force participation increased from just 11 percent in 2000 to 26 percent by the end of 2019, marked by an unprecedented shift in both the number and types of jobs available for Saudi women, and driven in part by a slate of ambitious labor reforms that began in 2011. Those policy shifts have coincided with more progressive social norms toward women’s work outside the home in Saudi society, though households are likely slower to adapt than the rapid policy changes would suggest.

Much of this growth has been concentrated among young women with secondary-level degrees, and Saudi women with high school diplomas have seen the largest growth in private sector employment of any demographic group in Saudi Arabia since 2011. The accompanying Figure shows the increase in private sector employment by educational attainment for Saudi women from 2009 to 2015. This sudden shift in economic prospects highlights the importance of mentoring for young Saudi women, many of whom are likely the first in their families to complete secondary (or tertiary) schooling and enter the labor force. Mentoring may come from people outside the family, such as teachers and friends, or from role models within the family: mothers, fathers, siblings, and other extended family members.
While research has revealed the importance of mentorship in the development of women’s careers, less is known about the impact of mentoring at a relatively early age. This research fills that gap by examining the impact of a formal mentoring program on female youth labor market aspirations, and how this intersects with existing familial influence in the study’s Saudi setting, where female employment has been historically low. The authors explore these effects against the backdrop of the COVID-19 crisis, in which lockdowns interrupted access to outside mentors and increased the importance of within-household relationships, to find the following:
- Short-term formal mentoring interventions that provide role models of working women outside the household can have a positive effect on the medium-run aspirations of high school students to work outside of the home
- In-household role models, including fathers and working mothers, can boost the effect of the external mentoring
Finally, while this work shows the importance of a short-term formal mentoring intervention for high school female students on their career aspirations, the authors stress the need for future study that investigates the household dynamics that boost or moderate the impact of formal mentoring programs.
-
Economic uncertainty rose to record levels in the wake of the COVID-19 pandemic in the United States, fueled by concerns over the direct impact of the virus and the public policy response. Many uncertainty measures remain elevated relative to their pre-pandemic levels, even as the economy has recovered.
The authors examine the evolution of several uncertainty measures that are both forward-looking and available in near real-time. Their analysis benefits from real-time measures that supplement traditional macro indicators, which become available with lags of weeks or months. Forward-looking uncertainty measures gleaned from business decision makers prove especially useful for assessing prospective responses to a pandemic shock or other fast-moving developments.

In brief, the authors find the following:
- Equity market traders and executives at nonfinancial firms have shared similar assessments about uncertainty at one-year look-ahead horizons. Put another way, the authors find that, contrary to the message in the popular press, they see little disconnect between “Main Street” and “Wall Street” views.
- The 1-month VIX (an index designed to show future market volatility), the Twitter-based Economic Uncertainty Index, and macro forecaster disagreement all rose sharply at the onset of the pandemic but retrenched almost completely by mid-2021. Thus, these measures exhibit a somewhat different time pattern than the one-year VIX and the authors’ survey-based measure of business-level uncertainty.
- The newspaper-based Economic Policy Uncertainty Index shows that much of the initial pandemic-related surge in uncertainty reflected concerns around healthcare policy, which moderated post-vaccines, as well as fiscal policy and regulation. Rising inflation concerns and Russia’s invasion of Ukraine became important sources of uncertainty by 2022.
- An analysis of the Survey of Business Uncertainty (SBU)1 reveals that firm-level risk perceptions shifted sharply to the upside beginning in the summer and fall of 2020 and continuing through March 2022, revealing that decision makers in nonfinancial businesses share some of the optimism that seems manifest in equity markets over this time.
- Special SBU questions reveal that recently high uncertainty levels are exerting only a mild restraint on capital investment plans for 2022 and 2023. This finding differs from earlier in the pandemic, when first-moment revenue expectations were softer and downside risks still loomed large.
The authors note that these and other results illustrate the value of business surveys like the SBU that directly elicit own-firm forecast distributions and self-assessed effects of uncertainties on investment and other outcomes of interest.
1 In partnership with Steven J. Davis of Chicago Booth and Nicholas Bloom of Stanford, the Federal Reserve Bank of Atlanta developed the Atlanta Fed/Chicago Booth/Stanford Survey of Business Uncertainty (SBU), a panel survey that measures one-year-ahead expectations and uncertainties that firms have about their own employment and sales. (atlantafed.org/research/surveys/business-uncertainty)
-
Gender equality begins at home. That is one possible take-away from this new research that asks whether fathers invest less in their daughters than their sons, and whether mothers are less discriminatory against their daughters. The answers matter not just for families and their children but also for policy. For example, as women gain more say in household decision-making, household spending on daughters may increase, producing more gender equality in the next generation. This virtuous cycle could help to close gender gaps in schooling and health care that are pervasive in developing countries.

To investigate these questions, the authors adopt a new approach to measure parents’ spending preferences. In a study conducted in rural Uganda among 1,084 households, the authors elicit and compare mothers’ and fathers’ willingness to pay (WTP) for various goods for their sons and daughters. This methodology improves upon existing approaches in the literature that focus on exogenous changes in women’s and men’s income; instead, the authors’ approach offers higher statistical power and the ability to choose goods with attributes that enable them to test mechanisms. The authors’ findings include:
- Fathers have a significantly lower WTP for their daughters’ human capital than their sons’ human capital.
- In contrast, mothers, if anything, have a higher WTP for their daughters’ human capital than their sons’. As a result, willingness to spend on daughters is higher among mothers than fathers.
Why do these differences exist? Researchers have posited that returns to parental inputs may benefit parents in different ways. For example, women live longer and have lower income expectations than men; this could cause mothers to spend more on their daughters than fathers do if mothers believe, as most do, that daughters are more likely to help support their parents in old age.
To test these hypotheses, the authors examine whether there are similar mother-father/son-daughter WTP differences for goods that bring joy to the children but do not add to their human capital: toys and candy. Under an investment-based explanation, one would expect observable gaps for human capital goods, but not toys and candy. Conversely, the patterns being similar for both types of goods would support a preference-based explanation. The authors’ evidence supports a preference-based explanation:
- Fathers have a lower WTP for goods that bring joy to their girls than to their boys, suggesting that they have less altruism or love for their daughters than their sons.
- Mothers, in contrast, have no lower WTP for goods that bring joy for their girls than for their boys.
The authors also collect data on which parent the respondents view as caring about the children more and find that the mother-father differences are driven entirely by households where both parents believe the mother loves the children more than the father does. Finally, although the authors find no evidence in the data for investment-based explanations, they cannot entirely rule out this explanation.
The authors stress that theirs is not the final word on these issues, as other questions persist. For example, do parents identify more closely with same-gender children, and does such identification explain WTP? If so, then parental resources matter. If mothers and fathers had equal financial resources, such favoritism would cancel out. However, because men control more resources than women do, daughters end up disadvantaged. Regardless of the question, though, this work shows the value of WTP elicitation as a research design.
-
The economic fallout from the COVID-19 pandemic was swift and severe. However, this was no typical economic downturn. The pandemic impacted consumption beyond the normal recessionary channel of income shocks and employment uncertainty. Outlets and opportunities for leisure travel, dining, and entertainment (e.g., movie theaters) were greatly restricted. Many individuals, especially those shifting to remote work, spent far less time outside of their residence.

These and other effects came amid a large and sustained response from the federal government. The $1.7 trillion CARES Act, passed in March 2020, included provisions for direct stimulus payments of up to $1,200 per adult and $500 for each qualifying child. In addition, unemployment insurance (UI) benefits expanded by $600 per week amid relaxed eligibility criteria. These UI and stimulus benefits were partially extended by further legislation, which contained another $2.7 trillion of spending. Taken together, households received just over $800 billion in stimulus payments, while spending on UI jumped from $28 billion in 2019 to $581 and $323 billion in 2020 and 2021, respectively.
Understanding how the countervailing forces of pandemic-related economic disruption and the associated policy responses affected the economic circumstances of households is critically important for assessing the impact of relief efforts and shaping future policy during economic and epidemiological crises. This paper examines changes in consumption and expenditures before and after the start of the pandemic using data from the Consumer Expenditure Interview Survey (CE) through the end of 2020. The authors find the following:
- After the onset of the pandemic, those at the bottom of the consumption distribution experience modest or no reduction in consumption, while those higher up see progressively larger and significant falls, concentrated in the second quarter of 2020. This decline at higher percentiles explains the sharp decline in aggregate consumption.
- The most pronounced decline is for high-educated families near the top of the consumption distribution and seniors in the top half of the distribution. The decrease in the top half is less evident for non-Whites than for White non-Hispanics, particularly for the 90th percentile during the latter half of 2020.
- The patterns for income are different than the patterns for consumption; incomes increase across the board in the first half of 2020, and this increase is larger for those at the bottom of the distribution.
- The changes in the composition of consumption are consistent with families spending more time at home, especially families with greater levels of material advantage. Food away from home, gasoline and motor oil, and other consumption decline throughout the distribution, but especially at the top, and housing consumption increases, especially at the bottom.

Importantly, the authors stress that their results do not imply that the pandemic did not have any negative impacts on economic well-being for disadvantaged families. Their finding that consumption did not fall at low percentiles might mask heterogeneity in the impact of the pandemic, where some families experience a sharp decline in economic well-being, while others experience gains.
Moreover, while consumption is arguably a better measure of economic well-being than income, it misses important dimensions of overall well-being. The profound disruptions from the pandemic such as the closures of schools, stores, churches, and other facilities, the uncertainty about future income streams, concerns about the health of family and friends, and other disruptions likely had adverse effects on the well-being of many families, and these disruptions are not directly captured by this paper’s measures of consumption.
-
Whether poverty has risen or fallen over time is a key barometer of societal progress in reducing material deprivation; likewise, accurate measurement is key. While many existing estimates of poverty try to address such factors as price index bias when computing poverty rates, their reliance on surveys means that those estimates suffer from substantial and growing income misreporting.

This paper is the first to use comprehensive income data to examine changes in poverty over time in the United States, meaning that survey data are linked to an extensive set of administrative tax and program records, such as those of the Comprehensive Income Dataset (CID) Project. Using the CID allows the authors to correct for measurement error in survey-reported incomes while analyzing family sharing units identified using surveys. In this paper, the authors focus on individuals in single parent families in 1995 and 2016, providing a two-decade-plus assessment of the change in poverty for a policy-relevant subpopulation.
Single parents were greatly affected by welfare reform policies in the 1990s that imposed work requirements in the main cash welfare program and rewarded work through refundable tax credits. Single parents are also targeted by many current and proposed policies, including a 2021 proposal to expand the Child Tax Credit to all low- and middle-income families regardless of earnings. The authors find that:
- Single parent family poverty (income below 100% of the threshold), after accounting for taxes and non-medical in-kind transfers, declined by 62% between 1995 and 2016 using the CID. In contrast, it fell by only 45% using survey data alone.
- Deep poverty (income below 50% of the threshold) among single parent families decreased between 1995 and 2016 by more than 20%, after accounting for taxes and non-medical in-kind transfers. This finding contrasts with survey-reported results, which show a 9% increase.

For policymakers, these findings provide strong evidence that correcting for underreported incomes can substantially change our understanding of poverty patterns over time and, thus, they hold powerful implications for current and future policies affecting assistance to low-income families.
-
You know those recurring billing notices that you get for subscription music and movie services, the ones that never go down in price but often increase? How many times have you cancelled one of those services and signed up for a cheaper alternative? Or cancelled an existing subscription and then re-upped at a lower introductory rate? Like most people, you probably rarely take these actions. Such is inertia, the tendency of an individual to take no action and stay in the same state as before.
Far from trivial, inertia has consequences for firms and policymakers trying to assess the functioning of markets. For example, consumer inertia incentivizes firms to offer choices that are better in the short run but worse in the long run. Further, firms can design their products to increase inertia. It matters, in other words, if consumers are aware of their inertia and, if so, whether and how they act on it.

To investigate this phenomenon, the authors assess how inertia affects consumer decisions regarding digital newspaper subscription contracts. What is the degree of inertia in consumer subscription choices? What is the degree of awareness to future inertia and how does it affect subscription choices? How do these differ between consumers? And what are the effects of these forces on firm incentives and outcomes?
To answer these questions and, importantly, to consider consumers’ state of mind before they make a choice, the authors run a large-scale field experiment in which they randomize the terms of the subscription offers received by 2.1 million readers who hit the digital paywall of a large European daily newspaper. Consumers are offered subscriptions that (1) either automatically renews, by default, into a paid subscription for those who take the promotion, unless they explicitly cancel it or does not automatically renew but requires the promo taker to click to enroll into a paid subscription; (2) has a promotional trial period for either 4 weeks, or 2 weeks; or (3) has a promotional price of either €0, or €0.99. The authors track these consumers over two years.
By varying contract renewal terms along with other benefits, the authors can quantify the inertia consumers anticipate from taking up the subscription before they take it. Consumers’ subsequent subscription behavior enables the authors to quantify the actual inertia they experience, and they find the following:
- Consumers are less likely to take a future-inertia-exploiting contract—24% fewer readers take up any newspaper subscription during the promotional period when offered an auto-renewal offer, relative to an auto-cancel offer.
- Consumers are more inert than they anticipate—the subscription-rate (the proportion of days a reader subscribes to the newspaper) is higher by 20% among those who received the auto-renewal offer, relative to the auto-cancel one for about four months post promotion.
- Offering inertia-inducing contracts discourages readers from engaging with the newspaper—readers who were assigned an auto-renewal offer are 9% less likely to become paid subscribers at any time in the two years after the promotion, relative to auto-cancel.
These findings reveal that most consumers are not naive or myopic about the future implications of the subscription contract terms. While some do take-up the auto-renewal contract and exhibit inertia, more than a third recognize and avoid a contract that might “exploit” them in the future, and another third are not inert and do not become high-paying subscribers. Only one-tenth of auto-renewal subscribers remain subscribed for more than three months and wouldn’t have under an auto-cancel contract.
Businesses and regulators take note. While many companies try to increase profits by dissuading consumers from quitting services, this novel work reveals that such practices, even if mild, can backfire for two reasons. First, exploiting future inertia reduces initial take-up; and second, exploiting future inertia pushes new consumers to disengage from the company completely.
Bottom line: In the long term, consumer behavior disincentivizes auto-renewal offers, even though auto-renewal leads to higher firm revenue in the medium term because of inertial subscribers.
-
Basic asset pricing theory predicts that high expected returns are a compensation for risk. For anyone who has managed their investment portfolio, this makes intuitive sense. There are risk factors to consider with bonds (duration and default risk, for example), equities (valuation and momentum, to name just two), as well as macroeconomic risk factors with broad influence (interest rates, inflation, and many others).
However, can risk alone explain the difference in expected returns generated by a given factor? Can high expected returns also encompass anomalies due to institutional or informational frictions, or behavioral biases like loss aversion, overconfidence, mental accounting errors, and so on? The authors address these questions through novel, simple-to-use tests that shed light on the economic content of factors and assess whether risk alone can explain the difference in expected returns generated by a given factor.
Broadly described, researchers typically determine risk factors by subtracting low-return portfolios from high-return portfolios, since each represent a level of risk; likewise, portfolios mimic a long-short strategy. (Readers are encouraged to visit the working paper for a more detailed description). Factors have a long leg with high expected returns and a short leg with low expected returns, with higher expected returns of the long leg corresponding to higher risk. However, risk alone cannot always explain the spread in expected returns between the two legs of a given factor, and the authors call this phenomenon an “anomaly.”
The authors develop simple-to-use tests to check whether every possible risk-averse individual strictly prefers the long-leg returns over the short-leg returns. If this is the case, even an individual with very high level of risk aversion would prefer the long leg, so risk cannot explain the difference in expected returns between the two legs. An anomaly exists.
Conversely, if a risk-averse individual prefers to forego the higher return of the long leg in exchange for the lower return of the short leg, then risk alone can explain the factor’s expected return, i.e., the difference in expected returns between the long and the short leg. Thus, in accordance with basic asset pricing theory, the factor’s expected return is a possible compensation for the higher risk of the long leg.
The paper’s main empirical finding indicates that most factors are anomalies rather than possible risk factors. They come to this conclusion by applying their tests to a standard data set of more than 200 potential factors to reveal that more than 70% of factors are anomalies. This finding is contrary to the literature, which holds that such factors as value, momentum, operating profitability, investment, and momentum are risk factors.
By offering methodological improvements to understanding risk factors and anomalies, this paper challenges existing theory. However, what sounds like a mere academic exercise has practical implications. For example, if a factor corresponded to risk, an individual would likely try to limit her exposure to this factor. Conversely, if a factor corresponded to an anomaly, an individual would likely want to load on it—if possible—and thus earn a higher expected return. Likewise, for investment decisions, firms would likely account for a risk factor to value investment projects, but not necessarily for an anomaly. More generally, unlike an anomaly, a risk factor can be used for discounting, which is key both in asset pricing and for real investment decisions.
-
Productivity growth is arguably the most important engine of growth in developed economies; likewise, accurate measures of productivity are important for researchers and policymakers in understanding the health of an economy. However, in recent decades researchers have struggled to capture the returns from information technology (IT). Famously, official data recorded a productivity slowdown in the 1970s and 1980s in the United States while computers were revolutionizing business processes. Something seemed amiss. The phenomenon continues today with advances in, for example, broadband internet.

This paper addresses this conundrum by offering a new methodology that better captures the effects that technologies can have on an economy. While technical in nature, the authors offer the following example to describe their contributions. Imagine two states of the world: one state without a given technology and one state with this technology. Moreover, assume a Cobb-Douglas production function, that the technology is skill-biased, that each firm uses skilled and unskilled workers as inputs, and that they produce a homogenous output. In this example, a technical change has two key consequences: the output elasticity of skilled workers increases, and firms hire more skilled workers. The skilled workers that are hired because of skill-biased technical change (SBTC) increase output for two reasons: they increase output by the pre-SBTC output elasticity; and second, after the SBTC their output elasticity increases. Only the second component represents an increase in the productivity of skilled workers.
The conventional measurement approach falsely overestimates the productivity of skilled workers pre-SBTC and, hence, adjusts the contribution of newly hired skilled workers to output post-SBTC by too much. As a result, the estimated impact of the technical change does not capture the full factor-biased component. Thus, productivity measurements will be lower than the actual expansion in the overall productive capacity.
To address this issue, the authors propose measurement parameters that apply to the time before a new technology is adopted, to construct estimates that allow the factor-biased component of the shock’s effect on productivity to be fully included in estimates.
Bottom line: The authors find that the factor-biased nature of technological progress, if ignored, leads to the erroneous conclusion of only modest productivity gains from adopting new technology when the actual gains are considerable.
-
Central banks around the world actively try to manage inflation expectations, and they make assumptions about how households will react to interest rate changes in terms of, say, consumption, savings, debt, and investment decisions. The importance of those policymaking assumptions and their influence on monetary policy are reinforced during times like the present when households, after years of low and stable inflation, are suddenly confronted with a spike in prices amidst heightened future uncertainty.

This leads to an important question: How well do economists and central bankers understand households’ inflation expectations? In a chapter for a forthcoming book (Handbook of Subjective Expectations), the authors of this paper review recent economic literature to reveal that long-standing models which formed the basis for most monetary policymaking in recent decades miss the mark. Essentially, those models assume that households view an increase in nominal interest rates as a one-for-one transmission to real interest rates. In other words, when nominal rates increase by 0.25 percentage points, households expect the same for real rates.
Recent work has challenged these long-held assumptions as models have improved to include heterogeneity among agents (or actors within models), to reveal that inflation expectations are upward biased, dispersed, and volatile. These newer models are informed by survey-based data and reveal that inflation expectations differ across:
Gender — women have higher expectations than men.
Age — younger individuals have lower inflation expectations.
Race — while sample sizes complicate findings, there is evidence that Blacks tend toward higher inflation expectations than Whites or Asian Americans.
Income — inflation expectations of respondents who earn less than $50,000 per year are about 1 percentage point higher than for respondents who earn more than $100,000.
Education — college-educated respondents’ inflation expectations are about 3% before the Covid-19 pandemic, whereas respondents who never attended college expect inflation around 4% in most months. Lesser-educated respondents also display more volatile expectations.
Place — Respondents in the US West have higher average inflation expectations in most months, with variation owing to regional business-cycle dynamics.
Bottom line for policymakers: Personal exposure to price signals in daily life like during shopping trips and cognition mediate the role of abstract knowledge and information and are the best predictors of actual, decision-relevant inflation expectations. A wealth of new data in recent years fuel this insight and provide inputs for the development of new models that are consistent with these empirical advances.
-
The U.S. Supplemental Security Income (SSI) program provides cash assistance to the families of 1.2 million low-income children with disabilities. When these children turn 18, they are reevaluated to determine whether their medical condition meets the eligibility criteria for adult SSI. About 40% of children who receive SSI just before age 18 are removed from SSI because of this reevaluation. Relative to those who stay on SSI in adulthood, these children lose nearly $10,000 annually in SSI benefits in adulthood.

Among other issues, this raises questions for policymakers and researchers about the long-term effects of providing welfare benefits to disadvantaged youth on employment and criminal justice involvement. On the one hand, cash assistance could provide a basic level of income and well-being to youth who face barriers to employment and thereby reduce their criminal justice involvement. On the other hand, welfare benefits could discourage work at a formative time and discourage the development of skills, good habits, or attachment to the labor force, potentially even increasing criminal justice involvement.
To investigate these questions, the authors build a unique dataset that allows them to measure the effect of SSI on joint employment and criminal justice outcomes, and to follow the outcomes of youth for two decades after they are removed from SSI. The first-ever descriptive statistics from this linkage indicate that nearly 40% of recent SSI cohorts are involved in the criminal justice system in adulthood, making criminal justice involvement a high-powered outcome for individuals who received SSI benefits as children.
Among other results, the authors find the following:
- SSI removal at age 18 in 1996 increases the number of criminal charges by a statistically significant 20% (2.04 to 2.50 charges) over the following two decades, with concentration in activities for which income generation is a primary motivation.
- “Income-generating” charges (such as burglary, theft, fraud/forgery, robbery, drug distribution, and prostitution) increase by 60%, compared to just 10% for charges not associated with income generation.
- The likelihood of incarceration in each year from ages 18 to 38, averaged over the 21 years, increases from 4.7 to 7.6 percentage points, a statistically significant 60%, in the two decades following SSI removal.
- Men and women respond differently to SSI removal. For men, the largest and most precise increase is for theft charges, and the annual likelihood of incarceration for men increases from 7.2 to 10.8 percentage points (50%).
- The effect of SSI removal on criminal charges is even larger for women than for men, and for women is concentrated almost exclusively in activities associated with income generation. Like men, the largest effects for women are for theft charges, but unlike men, women also have large increases in prostitution charges and fraud charges. The annual likelihood of incarceration for women increases from 0.7 to 2.4 percentage points (220%).
- Illegal income-generating activity leads to higher rates of incarceration, especially for groups with a high baseline incarceration rate, including Black youth and youth from the most disadvantaged families.
- Broadly, this work suggests that contemporaneous SSI income during adulthood is not the primary driver of criminal justice involvement. Instead, it is more likely the loss of SSI income in early adulthood that permanently increases the propensity to commit crimes throughout adulthood.
- Finally, the costs of enforcement and incarceration from SSI removal approach, and thus nearly negate, the savings from reduced SSI benefits.
This work raises key questions for future research that have important implications for policymakers, especially concerning the likely effects of new or expanded general welfare programs. For example, should we expect the broader population of disadvantaged children to respond similarly to welfare benefits compared to children receiving SSI? And are the effects of gaining and losing welfare benefits symmetric, or does losing benefits have a larger effect than gaining benefits?
-
Recent studies have shown that voters, whether members of households or sophisticated credit analysts, hold political perceptions that shape their views of the economy. Are things going well for the economy under a president from Party A? Your view is likely influenced by your affiliation with Party A or B.
However, what do we know about whether and how these voters make economic decisions based on their political perceptions? When it comes to investment, what are the economic implications of this partisan-perception phenomenon, especially regarding cross-border capital allocation? That is, do people project their domestic political perceptions on to foreign governments and, hence, make like-minded economic decisions?

This research is the first to provide answers to these and other questions relating to cross-border capital allocation by investigating whether cross-border investments by large institutional investors are shaped by an ideological alignment with elected foreign parties. The authors use two independent settings, syndicated corporate loans and equity mutual funds to analyze cross-border capital flows, including at the level of individual banks and mutual funds.
Among other results, the authors find that:
- Belief disagreement is a likely mechanism driving observed differences in capital allocation by US investors. This finding is supported by evidence of banks’ downward-revision of GDP growth forecasts when they experience an increase in ideological distance, relative to banks that experience a decrease in ideological distance.
- To put a number on it: When a bank experiences an increase in ideological distance after a foreign election, it reduces its lending volume by 22% and the number of loans by 10%.
- Further, the authors document a decrease in the loan quantity provided by misaligned banks even within the same loan, a finding that allows them to rule out that the relative decline in loan quantity is driven by differences in borrower demand.
- In terms of loan pricing, the authors find a sizable, positive effect of ideological distance on loan spreads. An increase in ideological distance is associated with a 13.9% increase in loan spreads, which translates to approximately 30 basis points for the average loan in their sample.
- Partisan perception can affect the net supply of capital by foreign investors. Importantly, ideological alignment between countries can explain patterns in bilateral portfolio and foreign direct investment.
- Bottom line: Ideological alignment is a key—and omitted—factor in current models of international capital flows.
Regarding partisan perception’s effect on non-US investors, the evidence is mixed. Differences in data availability and reporting thresholds for political contributions across countries do not allow the authors to reach firm conclusions. Likewise, questions relating to the sources of cross-country differences in the influence of partisan perception on economic decisions would motivate interesting future research.
-
China’s land market, a key driver of the country’s extraordinary economic growth over the past 40 years, does not provide revenues to local governments via property taxes, as do most developed economies. Rather, local governments serve as monopolistic sellers who control land supply and who rely heavily on land sales for fiscal revenue.
Rigid zoning restrictions in China classify different land parcels for different uses, with land zoned for residential use selling at roughly a ten-fold higher price than land zoned as industrial, which the authors term an industrial land discount (or industrial discount). Local governments, it would seem, face a tradeoff between selling residential property to raise revenues or selling industrial property at a discount to spur local economic growth for non-pecuniary reasons. At least, that is how conventional wisdom describes the tradeoff. This paper offers a different explanation by focusing, instead, on public finance rather than industrial subsidies to explain the industrial discount.

The authors propose that the choice between residential and industrial land sales involves an intertemporal revenue tradeoff. Chinese local governments are predominately funded through a combination of corporate tax revenues and land sale revenues, which together account for roughly 60% of local government revenue. Industrial land generates future tax flows, since industrial firms pay value-added taxes and income taxes along with various fees; residential land does not. This simple fact leads to a new description of the tradeoff described above:
- Local governments face a choice between selling residential land, which pays larger upfront revenues from higher sale prices, versus selling industrial land, which pays smaller upfront revenues but comes with a stream of future cash flows from tax revenues over time.
This dynamic perspective suggests that local governments are not necessarily subsidizing industry through cheap land; in fact, the authors show that future tax revenues from industrial land more than compensate for the upfront discount on industrial land sales. This result has strong implications for understanding the drivers of land prices in China, and how they are linked to the tax sharing scheme with the central government, as well as local governments’ intertemporal revenue tradeoffs. From the central government’s perspective, the tax sharing scheme between the central and local governments can be carefully designed to counteract the effect of the local governments’ differential market power in local land markets to achieve desired land allocation outcomes.
Taking stock, this paper shows that local governments’ financing needs affect land supply to the whole industry sector in China, which implies that local public finance plays an underappreciated role in shaping the path of China’s economic growth through the land allocation channel.
-
By 2016, the United States had surpassed 100,000 deaths annually from alcohol- or drug-induced causes, with more than 90 percent of the deaths occurring among the nonelderly, and these levels increased in 2020 and at least through mid 2021, up to about 30 percent over trend. This paper investigates whether changes in regulatory and government spending policies, especially including increases in unemployment insurance (UI) payments, affected drug and alcohol mortality rates.

Mulligan constructs a model that documents changes in disposable income, marginal money prices of drugs and alcohol, and the full price of (especially) drugs as it relates to the value of time. In other words, if we assume that people’s preference for drugs and/or alcohol stays the same, their demand for such products would vary with, say, variations in income, price, and other demand factors. Mulligan’s model incorporates this insight to investigate whether and how demand factors vary over time, across substances, and across demographic groups, and then makes predictions on the timing and magnitude of mortality changes by substance. This novel model yields the following findings:
- Unlike suicide deaths, alcohol-induced deaths and deaths involving drug poisoning in the United States during the pandemic were each above prior trends. The increase in drug deaths lagged acute alcohol deaths by a month. As before the pandemic, these deaths primarily involved alcohol, opioids, or crystal methamphetamine (meth).
- Drug deaths between April 2020 and June 2021 were about 11,000, corresponding to more than 400,000 life years lost, above trend due to the substitution effects of unemployment bonuses.
- Substitution to home alcohol consumption explains another 7,300 deaths corresponding to more than 200,000 life years.
- Moderate income effects of stimulus checks, rent moratorium and unemployment bonuses (less than one percent spent on opioids or meth) explain another 20,000 alcohol and drug deaths or about 750,000 life years.
Importantly, these findings do not contradict or confirm observations that the pandemic elevated feelings of depression and anxiety. However, these results do challenge the thesis that alcohol and especially drug mortality during the pandemic were primarily driven by new feelings of depression or loneliness. Suicide did not increase in the United States, while drug mortality fell sharply in the months between the $600 and $300 unemployment bonuses. To the extent that pandemic depression and loneliness initiated new drug and alcohol habits, they might not yet be reflected in the mortality data but will elevate mortality in the years ahead.
Mulligan stresses that there are many outstanding questions about drug markets during the pandemic that demand attention, and that research into other countries and markets could bring useful insight. Also, future research may show that the theoretical approach of this research yields results more in line with coincidence than predictability. Even so, if the income and substitution effects described in this work are not important factors, then researchers are left with profound puzzles, including: Why do overall alcohol and drug deaths increase significantly while suicides and fatal heroin overdoses decrease? Why do deaths involving psychotropic drugs (especially meth) increase in lesser proportions than both alcohol and narcotics deaths, even while some important narcotics categories do not increase? And why do mortality rates change across age groups?
-
Much research in recent years has focused on potential gains to education from replacing low-performing teachers or otherwise reassigning teachers to different schools. However, reassigning teachers to achieve allocative gains is not easy because teachers care about where they teach, and they have some power in determining at which schools they are employed. Teacher preferences, in other words, may not align with optimal productivity.

This paper explores the potential student achievement gains from within-district teacher reassignment and the effectiveness of combinations of different policy levers in achieving these gains. To conduct their analysis, the authors employ an equilibrium model of the teacher labor market combined with novel data on job vacancies and applications. These data come from the job application system of a school district in North Carolina and include the timing of all teacher applications to open vacancies and the outcome of each application (including whether the teacher was hired and whether the hiring principal rated the application positively). Importantly, the authors also link the applicant data to the classroom assignment and student achievement data in North Carolina. Finally, the data also allow the authors to characterize each teacher’s value-added, and to estimate the joint distribution of preferences and value-added.
The authors find the following:
- Teachers prefer positions described by homogeneous characteristics (e.g., fraction of advantaged students) and heterogeneous characteristics (e.g., commute time), with only slight preference toward positions where they have higher value-added. Giving teachers the ability to choose their position leads to excess supply at schools with advantaged students and sorting based on non-output heterogeneity. Thus, if teachers have some degree of choice in their assignment, then the district may want to counteract the sorting by changing how teachers value positions (e.g., with bonuses).
- On the principal side, the authors find preferences for teachers who produce more student achievement, but that differences in output only explains some of the variation in preferences. Thus, the district might consider changing how principals value teachers.
- Things get complicated when these preferences are combined, as played out in the authors’ model. When teachers receive bonuses for output, they sort toward positions closer to the first-best position. When principals receive bonuses for output, they seek the best teachers. However, because absolute advantage dispersion is large, a second consequence of principal bonuses is that the strongest teachers get more choice. And more choice among teachers, as we can see from the first finding, does not necessarily lead to higher achievement.

What does this mean for policymakers? In a system where everyone gets paid on the same salary scale, teacher bonuses are the primary policy tool for realizing achievement gains because they align teacher and district preferences. But the optimal form of bonuses depends on how principals value teachers. Flexible prices (or salaries), though, would produce achievement gains at a much lower cost. While authors find that district teacher value-added is relatively balanced across student types, their data and framework could be useful in designing policies that go beyond equalizing achievement gains to try to close baseline gaps.
-
Unemployment Insurance (UI) is a significant part of the social insurance safety net in the United States and around the world. The experience of COVID-19 illustrates the critical role that UI can play in the face of enormous aggregate shocks. It also highlights an issue that has been a perennial focus of UI policy: how the duration of benefits should depend on the state of the economy.

UI benefits in the United States are currently set to 26 weeks in most states. Extended benefits (EB) begin if a state’s insured or total unemployment rate exceeds legislated thresholds, with additional duration of 13 or 20 weeks. The current EB system has two potential shortcomings. First, the stringency of the trigger thresholds (including allowing states to opt out of the less stringent triggers) means that the system rarely actually triggers. Second, the additional 13 or 20 weeks may provide inadequate coverage during severe recessions. In response, Congress has enacted temporary additional extensions during each recession over the past 40 years, with extensions on 5 separate occasions ranging from 6 to 53 weeks.
For decades, economists have recommended replacing a system where extended durations of UI benefits are decided by legislative fiat to a more systematic linkage between benefit durations and economic conditions. However, the actual design of such automatic extensions has not been the subject of much previous analysis. In this paper, the authors develop a simulation model to analyze the tradeoffs inherent in different extension policies, and they reach three conclusions:
- Policies designed to trigger immediately at the onset or even before a recession starts result in benefit extensions that occur in less sick labor markets than the historical average for benefit extensions.
- Ad hoc extensions in past recessions compare favorably ex post to common proposals for automatic triggers, with one important disclaimer: Past behavior is no guarantee of future legislative performance and there may be other benefits to automating policy.
- Finally, compared to ex post policy, the cost of more systematic policy is close to zero.
-
High economic policy uncertainty (EPU) can depress economic activity by causing firms to defer certain investments, by raising credit spreads and risk premiums (thereby dampening business investment and hiring), and by prompting consumers to postpone purchases of durable goods. While several studies provide evidence that uncertainty increases around elections and that election-related uncertainty has material effects on economic activity, this new paper provides the first evidence on the relative importance of state and national sources of state-level policy uncertainty, how these sources differ across states, and how they vary over time within states.

The authors employ the digital archives of nearly 3,500 local newspapers to construct three monthly indexes of economic policy uncertainty for each state: one that captures state and local sources of policy uncertainty (EPU-S), another that captures national and international sources (EPU-N), and a composite index (EPU-C) that captures both state + local and national + international sources. Half the articles that feed into their composite indexes discuss state and local policy, confirming that sub-national matters are important sources of policy uncertainty. Key findings include:
- EPU-S rises around presidential and own-state gubernatorial elections and in response to own-state episodes such as the California electricity crisis of 2000-01 and the Kansas tax experiment of 2012.
- EPU-N rises around presidential elections and in response to such shocks as the 9-11 terrorist attacks, the July 2011 debt-ceiling crisis, federal government shutdowns, and other “national” events.
- Close elections (winning vote margin under 4 percent) elevate policy uncertainty much more than less competitive elections; a close presidential election contest raises EPU-N by 60 percent and a close gubernatorial contest raises EPU-S by 35 percent.
- EPU spiked in the wake of the COVID-19 pandemic, pushing EPU-N to 2.7 times its pre-COVID peak, and (average) EPU-S to more than four times its previous peak. Policy uncertainty rose more sharply in states with stricter government-mandated lockdowns.
- Upward shocks to own-state policy uncertainty foreshadow higher unemployment in the state.
This research also finds that the main locus of policy uncertainty shifted to state and local sources during the pandemic. The authors offer the following simple metric: Consider the ratio of EPU-S to EPU-N for a given state. The cross-state average value of this ratio rose from 0.65 in the pre-pandemic years to 1.1 in the period from March 2020 to June 2021. Since the timing, stringency, and duration of gathering restrictions, school closure orders, business closure orders, and shelter-in-place orders during the pandemic were largely set by state and local authorities, it makes sense that EPU-S saw an especially large increase after February 2020.
-
Surveys are a key tool for empirical work in economics and other social sciences to examine human behavior, while government operations rely on household surveys as a main source of data used to produce official statistics, including unemployment, poverty, and health insurance coverage rates. Unfortunately, survey data have been found to contain errors in a wide range of settings. For US household surveys, the quality of survey data has been declining steadily in recent years, with households more reluctant to participate in surveys, and participants more likely to refuse to answer questions and to give inaccurate responses.

Even though its relevance has been documented by researchers over the past two decades, there is still much to learn about measurement error, or how the reported responses of households differ from true values. In this paper, the authors study measurement error in surveys and analyze theories of its nature to improve the accuracy of survey data and estimates derived from it. The authors study measurement error in reports of participation in government programs by linking the surveys to administrative records, arguing that such data linkage can provide the required measure of truth if the data sources and linkage are sufficiently accurate. In other words, the authors link multiple survey results and program data to provide a novel, and powerful, examination of survey error.
Specifically, the authors focus on two types of errors in binary variables: false negative responses (failures of true recipients to report) and false positive responses (reported receipt by those who are not in the administrative data). Their findings, including the following, confirm several theories of cognitive factors that can lead to survey misreporting:
- Recall is an important source of response errors. Longer recall periods increase the probability that households fail to report program receipt. Problems of accurately recalling the timing of receipt, known as telescoping, are an important reason for overreporting.
- Salience of the topic improves the quality of the answer. The authors provide evidence that respondents sometimes misreport when the true answer is likely known to them, and that stigma, indeed, reduces reporting of program receipt.
- Cooperativeness affects the accuracy of responses, insofar as interviewees who frequently non-respond are more likely to misreport than other interviewees.
- Finally, regarding survey design, the authors find no loss of accuracy from proxy interviews. Their results on survey mode effects are in line with the trade-off between non-response and accuracy found in the previous literature.
This work has implications beyond the case of government transfers and the specific surveys studied in this paper and may allow data users to gauge the prevalence of errors in their data and to select more reliable measures. Further, the authors’ results and recommendations are broad enough to apply in many settings where misreporting is a problem. For instance, similar issues of data quality have been found in health, crime, or earnings studies, to name a few.
-
The COVID-19 pandemic has infected over 250 million and killed at least 5 million worldwide. Nearly two years into the crisis, many countries, such as India, have experienced second waves with infection levels greater than the initial wave, and now face a potential third wave from the Omicron variant that is larger still. Despite widespread availability in some countries, many others still face shortages, raising an important question: What vaccine allocation plan maximizes the health and economic benefits from vaccination?

Prior analyses of optimal vaccine allocation typically begin with a model of disease, then simulate or forecast the effect of various vaccine allocation plans, and finally compare plans based on certain metrics. The authors cite numerous studies that incorporate various features, from prioritization of elderly populations, to accounting for deaths averted and years of life saved, among other factors. This research builds on those prior evaluations of vaccine allocation in three important respects: it includes novel epidemiological data from a low-to-middle income country, India; it incorporates a robust economic valuation of vaccination plans based on willingness to pay for longevity; and—more importantly—it employs a model for social demand for vaccination that can guide governments’ vaccine procurement decisions.
Among other findings, this work reveals the following:
- Allocation matters. In countries such as India, with large populations and vaccine shortages, it matters who gets the vaccine first. Mortality-rate based prioritization may save a million more lives and 10 million more life-years.
- The social value of vaccination and the optimum number of doses to purchase rise with the rate of vaccination. It may be cost-effective to vaccinate—and thus to procure doses for—only a subset of the population if the rate of vaccination is low because vaccination campaigns are in a race against the epidemic. Slower vaccination means more people obtain immunity from infection, reducing the incremental protection from—and thus the social value of—vaccination.
- However, if the cost of speeding up vaccination is the inability to prioritize, it may be prudent in countries like India, for example, to choose a slower but mortality-rate prioritized vaccination plan. Vaccinating just 25% of the population in a year using mortality-rate prioritization saves more lives and life-years than vaccinating even 100% of the population in 6 months using random allocation. Protecting a small number of the elderly eliminates much of the remaining mortality risk from COVID-19 in India.
- A substantial portion of the social value from vaccination comes from improvement in consumption when vaccination reduces cases and permits greater economic activity.
This paper presents tools that can provide actionable policy advice, with estimates to help governments select optimal vaccination plans on a range of metrics. Importantly, these metrics consider economic factors that influence politicians, even though they may not be what the public health community recommends. Most importantly, these estimates recommend how many doses would be cost effective for governments to procure at different levels of vaccine efficacy and price.
-
Recent debate about the US federal minimum wage has centered around the call to boost the rate to $15 an hour from the current $7.25, which has been in place since 2009. In addition, the minimum wage has remained roughly constant in real terms since the late 1980s. Fifteen dollars is more than 2019 wages for 41 percent of workers without a college education, 11 percent for college educated workers, and 29 percent for workers overall (see related Figure).
There are two key rationales for a positive minimum wage: efficiency and redistribution. In the first case, if firms have market power in the labor market, wages are generically less than the marginal product of labor, and employment at each firm is inefficiently low. Writing in 1933, before the introduction of the federal minimum wage in 1938, labor economist Joan Robinson described how a minimum wage could help alleviate efficiency losses from monopsony power by inducing firms to hire more workers (monopsony describes when a firm doesn’t have to compete particularly hard to hire workers in the labor market). Regarding redistribution, a higher minimum wage has the potential to benefit low-income workers and reduce profits that tend to accrue to business owners and high-income workers, redistributing economic output.

This work addresses the first rationale for a minimum wage—efficiency—and thus focuses on the ability of a national minimal wage to address inefficiencies due to labor market power. In particular, the authors develop a quantitative framework to study the effect of minimum wages on welfare and the allocation of employment across firms in the economy. Broadly described, the model they construct includes interaction among heterogeneous firms in concentrated labor markets, as well as workers that are heterogeneous in terms of wealth and productivity. They use the model to study the macroeconomic effects of minimum wages, accounting for effects that ripple through the whole economy. (Please see the full paper for a detailed description of the authors’ model.)
When the authors’ model is calibrated to US data it proves consistent with a wide body of empirical research on the direct and indirect effects of minimum wage changes, and delivers the following findings:
Under the conditions specified in the model, an optimal minimum wage exists, and this wage trades-off positive effects from mitigating labor market power against negative effects from misallocation.
Quantitatively, the efficiency maximizing minimum wage is around $8 per hour, consistent with the current US Federal minimum wage.
However, higher minimum wages can be justified through redistribution when other government policies for redistribution are unavailable. When the authors apply social welfare considerations, they find an optimal minimum wage of around $15 an hour. Under such a policy, 95 percent of welfare gains come from redistribution and only 5 percent from improved efficiency.
The authors stress that their results do not rule out the minimum wage as a tool for reducing income inequality or increasing labor’s share of income, which are common empirical proxies for inequality and worker power, respectively. Indeed, they show that under a higher minimum wage, income inequality falls within and across worker types, and labor’s share of income increases. They warn, however, that as the minimum wage increases, wage inequality keeps on falling well past the point that welfare is maximized.
-
When the COVID19 pandemic spread across the United States and households were confronted with empty store shelves of common products like toilet paper and cleansers, they asked themselves questions that also confronted policymakers and researchers: Were those shortages a result of panicked buying, in which case they could wait for an increase in supply to quickly materialize, or from reduced production by manufacturers due to lockdowns or workers staying at home, in which case the shortage could be long-lived.
Strikingly, the average inflation expectations of households rose, consistent with a supply-side interpretation, but disagreement among households about the inflation outlook also increased sharply. What was behind this pervasive disagreement? Did households, like economists, disagree about whether the shock was a supply or a demand one? Or did they receive different signals about the severity of the shock due, for example, to the specific prices they faced in their regular shopping and heterogeneity in their shopping bundles? The answers to these questions can shed light not just on the pandemic period but more generally on the nature of household expectations, the degree of anchoring in inflation expectations, and the current inflation outlook as post-pandemic inflation rates spike.

To address these questions, the authors combine large-scale surveys of US households with detailed information on their spending patterns. Spending data allow the authors to observe in detail the price patterns faced by individual consumers and thereby characterize what inflation rate households experienced in their regular shopping. The researchers can then measure households’ perceptions about broader price movements and economic activity as well as their expectations for the future. Jointly, these data permit the authors to characterize the extent to which the specific price changes faced by consumers in their daily lives shaped their economic expectations during this unusual time.
Using both the realized and perceived levels of inflation by households, the authors find the following:
- Pervasive disagreement about the inflation outlook stems primarily from the disparate consumer experiences with prices during this period. The early months of the pandemic were characterized by divergent price dynamics across sectors, leading to significant disparities in the inflation experiences of households.
- Perceptions of broader price movements diverged even more widely across households, leading to very different inferences about the severity of the shock. These differences in perceived inflation changes were passed through not just into households’ inflation outlooks but also to their expectations of future unemployment.
- Finally, the widespread interpretation of the pandemic as a supply shock by households led those who perceived higher inflation during this period to anticipate both higher inflation and unemployment in subsequent periods.
The authors stress that these findings raise important implications for current and future policymaking. While the magnitude of the rise in disagreement was notable, the supply side interpretation of the shock by households was not. Instead, it was consistent with a more systematic view taken by households that high inflation is associated with worse economic outcomes. This view is likely not innocuous for macroeconomic outcomes. Since policies like forward guidance are meant to operate in part by raising inflation expectations, this type of supply-side interpretation by households is likely to lead to weaker effects from these policies as households reduce, rather than increase, their purchases when anticipating future price increases.
Further, as inflation expectations rose through 2021 and into 2022, households became more pessimistic about the economic outlook even as wages and employment rose sharply. This pessimism about the outlook creates a downside risk for the recovery and suggests that policymakers should be wary of removing supportive measures too rapidly. Patience in waiting for supply constraints to loosen therefore seems warranted since pre-emptive contractionary policies would likely amplify the pessimism that risks throttling the recovery from the pandemic.
-
The role of large corporations in society is a current topic of much debate in the United States, driven by such issues as workplace diversity, wage inequality, environmental protection, and increasing skepticism about the power of big tech companies. At its core, the debate reflects the tension between a 2019 statement by the Business Roundtable that calls for corporations to promote “an economy that serves all Americans,” and a famous 1970 statement by Milton Friedman that “the social responsibility of business is to increase its profits.”

Motivated by this public debate regarding corporate responsibility, this research employs theoretical behavioral modeling and an experimental survey design to study the general setting where individuals form policy preferences based on highly salient issues, and where political and corporate communication strategies may shape such preferences through persuasion. The authors focus on certain types of news stories or narratives, specific aspects of a policy decision that are contextually related to that coverage and made highly salient, so that the populace will view the policy decision through that narrow lens. Moreover, the authors account for how the media, by presenting issues in either a positive or negative light, and by using language or narrative setting, can lead people to certain views.
The authors’ model is inspired by a psychology model of associative memory recall that formalizes how links between communication and policy preferences can arise. Broadly described, communications and messaging provide cues that prime people to recall experiences like the cue. Policy preferences are thus dependent on the cue, since they impact the set of experiences used to evaluate the policy.
The authors then test their model against a novel, online survey of 6,727 US citizens, developed specifically to study the link between corporate responsibility and public support for corporate bailouts and related policies during the 2020 coronavirus crisis. Focusing on bailouts at a time of crisis provides an apt setting for the authors’ analysis, because the stakes are high, the public is engaged in the policy debate, and media, politicians, and corporations all play an active role in shaping the debate via extensive communication efforts.
The authors’ empirical analysis finds:
- Strong support from the public that corporations should behave better within society, a sentiment the authors label as “big business discontent.”
- And a strong baseline link between big business discontent and the support for economic policies, with people dissatisfied with large corporations’ behavior within society also opposing corporate bailouts.
- These empirical findings confirm the model’s prediction that positive communications surrounding corporate behavior can lead to less support for corporation-friendly policies than providing no communication if there are sufficiently negative established beliefs regarding corporate responsibility.
This final insight has significant implications for corporate and political communication strategies, especially if positive framing of an issue cannot be separated from priming the policy domain.
-
In recent years, governments and international organizations around the world have started transparency initiatives to expose corrupt practices in the allocation of public procurement contracts. How do such initiatives impact business practices? How, if at all, is the performance of firms and employees affected by such actions?
These questions and others motivate this new research, which uses micro-data from Brazil within a unique institutional setting to study the real effects of a large anti-corruption program on firms involved in illegal interactions with the government. The authors’ empirical design relies on a government initiative that randomly audits municipal budgets with the aim of uncovering any misuse of federal funds.

While the program targets the budget of municipalities, the audits expose the identity of specific firms involved in irregular business with the government. Most such firms are located outside the boundaries of the audited municipalities. By focusing on those firms, the authors can better isolate the direct effect of exposure of corrupt practices from its overall impact on the local economy of the audited municipality. In addition, the random nature of the audits provides the authors with a unique setting in which the timing of firm-level exposure is plausibly exogenous.
The authors reveal two key, seemingly contradictory findings:
- Firms exposed by the anti-corruption program experience, on average, a 4.8 percent larger increase in size (as measured by total employment in the firm) relative to the control group in the three-year period following exposure.
- Exposed firms experience a significant decrease in their access to procurement contracts over the same period. These effects indicate that while negative exposure generated by the anti-corruption campaign decreases a firm’s ability to rely on government contracts, it also benefits firm performance in the medium run, suggesting that firms were on average hindered by the presence of corruption they were directly involved in.
How to explain these conflicting findings? The authors argue that, by cutting access to government contracts for exposed firms, anti-corruption campaigns might force such firms to adjust their investment and business practices to compete in the market for private demand. They find evidence consistent with this mechanism using detailed micro data on firms’ investment and access to credit. On the other hand, the authors do not observe major changes in the internal organization of firms after exposure.
The authors chart out avenues for future research, including efforts to fully identify the links between corruption and firms’ growth strategies, and efforts to understand the specific ways through which operating in a corrupt environment might affect firm behavior. This work speaks to the extent to which an anti-corruption program impacts some of these margins, thus leaving several open questions more directly linking corruption and firm decisions.
-
The financial system affects economic growth via a variety of channels, including through the evaluation of prospective entrepreneurs, financing productive projects, diversifying risks, and encouraging innovation. There is also a unique financing vehicle at the intersection of the banking system and the stock market called share pledging, in which shareholders obtain loans with their shares as collateral and use the proceeds to finance various activities.
Share pledging is employed throughout the world; this work focuses on the role of share pledging in promoting entrepreneurial activities in China. Relentless market reform in the Chinese economy in the past several decades has witnessed an upsurge of entrepreneurship in the private sector. However, financing for this growth has likely not come from China’s largely state-owned banking system. Rather, this work focuses on the role of China’s share pledging market, with its enormous relative size, as an important financing vehicle for entrepreneurship.

Broadly, this novel research challenges the common wisdom that share pledging funds circle back to listed firms. Share pledging funds are at the discretion of the shareholders who pledge their shares (of the listed firms), and these funds therefore could be used to finance privately owned enterprises and entrepreneurs. Since China’s economic growth is largely driven by non-listed, small- and medium-sized firms rather than listed firms, the authors focus on identifying the driving forces behind China’s entrepreneurship.
China’s share pledging system was established in the mid-1990s, with the volume of newly pledged shares growing at an annual rate of 18.6% between 2007 and 2020. At the market’s peak in 2017, more than 95% of the A-share listed firms had at least one shareholder pledged, with the total value of pledged shares amounting to 6.15 trillion RMB (more than 10% of the total market capitalization).
Before 2013, share pledging was solely organized in the over-the-counter (OTC) market, where commercial banks and trust firms were major lenders. In 2013, share pledging was introduced to the Shanghai and Shenzhen stock exchanges, with securities firms as the major lenders. This initiative, which the authors use as a quasi-natural experiment, greatly expedited the development of share pledging: After this policy shock, the annual transaction volume between 2013 and 2020 reached 204 billion shares (1,057 billion RMB), compared to 39 billion shares (192 billion RMB) per annum during the period of 2007 and 2012.
What has this growth meant for listed firms? Is share pledging, as conventional wisdom suggests, an alternative financing tool? The authors find that during this same period, there was an upsurge of entrepreneurship and privately owned enterprises in China. New startups emerged in various industries, and some grew into today’s business giants. This leads the authors to the following key conjecture:
- Major shareholders of Chinese listed firms, with proven business acumen and strong social connections, have used the share pledging funds to finance their entrepreneurial activities outside listed firms.
And the following findings:
- Funds from only 7.8% of the pledging transactions are used for listed firms.
- A major fraction of firms (67.3%) reported their largest shareholders used the pledging funds outside the listed firms.
- These shareholders used the funds to repay personal debts (25.3%), for personal consumption (13.6%), and to make financial investments (5.2%).
- Importantly, 33% of firms reported that their largest shareholders invested the funds in firms other than the listed firm and created new firms.
- Finally, this data pattern, though descriptive, points to a positive relation between share pledging and entrepreneurial activities.
-
In lower middle-income countries like India, households face enormous challenges to finance healthcare. For example, in 2018, 62% of Indian households paid for healthcare out-of-pocket, compared with just 11% in the United States. Further, research shows that many Indian households fall into poverty by health costs, and care is often foregone due to expense.
To address these concerns, the Indian government in 2008 launched a hospital-insurance program for below-poverty-line households in India with a roughly 60% uptake (abbreviated RSBY) that was replaced 10 years later by an expanded program covering 537 million people (all those the below the poverty line plus nearly 260 million above). The new program, PMJAY, provided insurance largely for free in the hopes of attracting more people to enroll. However, utilization remained relatively low, reflected in the low fiscal cost of the program to India’s government, about 1% of GDP.

Why is utilization low? Could lower-income countries like India reduce pressure on public finances, without compromising uptake, by offering the opportunity to buy insurance without subsidies (i.e., pure insurance)? Importantly, does health insurance improve health in lower-income countries? To address these questions, the authors conducted a large randomized controlled trial from 2013-2018 to study the impact of expanding hospital insurance eligibility under RSBY, an expansion subsequently implemented in its successor program, PMJAY. The study was conducted in Karnataka, which spans south to central India, and the sample included 10,879 households (comprising 52,292 members) in 435 villages. Sample households were above the poverty line, not otherwise eligible for RSBY, and lacked other insurance.
To tease out the effects of different options for providing insurance, sample households were randomized to one of four treatments: free RSBY insurance, the opportunity to buy RSBY insurance, the opportunity to buy plus an unconditional cash transfer equal to the RSBY premium, and no intervention. To understand the role that spillovers play in insurance utilization, the authors varied the fraction of sample households in each village that were randomized to each insurance-access option.
The intervention lasted from May 2015 to August 2018, including a baseline survey involving multiple members of each household 18 months before the intervention. Outcomes were measured at 18 months and at 3.5 years post intervention, and included measures to address factors that could distort results (see paper for more details). The authors’ findings include the following:
- The sale of insurance achieves three-quarters of the uptake of free insurance. The option to buy RSBY insurance increased uptake to 59.91%, the unconditional cash transfer increased utilization to 72.24%, and the conditional subsidy (i.e., free insurance) to 78.71%.
- Insurance increased utilization, but many beneficiaries were unable to use their insurance and the utilization effect dissipated over time, reflecting such obstacles as households forgetting their card or trying to use RSBY at non-participating hospitals. The failure rate was lower among those who paid for insurance, which may indicate that prices screen for more knowledgeable, higher value users, lead to a “sunk cost,” or signal quality in a manner that increases successful use. Also, utilization fell over time: 6-month utilization was just 1.6% in the free-insurance group after 3.5 years. Instead of learning-by-doing, perhaps households were disappointed by the difficulty of using the new insurance product.
- Spillovers play an important role in promoting insurance utilization. The magnitude of spillover effects is roughly twice that of direct effects in the free-insurance arm at 18 months, suggesting that peer effects may play a role in learning how to utilize insurance.
- Finally, health insurance showed statistically significant treatment effects on only three outcomes among 82 health-related outcomes across two survey waves. That said, the authors do not rule out clinically significant health effects, and they stress that even this study, which is among the largest health insurance experiments ever conducted, may not be powered to estimate the health effects of insurance.
These findings have implications on the implementation of public insurance in India on two related counts: household use and marketing. In the first case, many households were unable to use their insurance due to complexity and/or lack of understanding. Likewise, policymakers could consider improved educational materials, higher reimbursement rates, and increased investment in IT to expand awareness.
Regarding marketing, spillover effects on utilization have implications for marketing insurance. With a fixed budget, the government may achieve greater utilization by focusing on increasing coverage within a smaller number of villages rather than spreading resources over more villages with lower coverage in each.
-
The Federal Reserve has recently emphasized the importance of understanding the labor market experiences of various communities when assessing its goal of maximum employment. Aggregate employment numbers, in other words, hide a lot of heterogeneity among groups, and the Fed has committed to addressing those differences.
However, there is little understanding of monetary policy’s effects on different segments of the labor market. Does monetary policy, often described as a blunt instrument, impact different communities in different ways? If so, are there certain economic conditions under which the Fed can effectively target labor outcomes across different types of workers and demographic groups?

To address these and related questions, the authors of “Inclusive Monetary Policy: How Tight Labor Markets Facilitate Broad-Based Employment Growth,” employed data from 895 local labor markets in the US between 1990 and 2019 to explore monetary policy’s heterogeneous effects with respect to workers’ race, education, and sex. Their key finding is that for demographic groups with low average labor market attachment—Blacks, the least educated, and women—monetary expansions have a larger effect on employment growth in tight labor markets. Importantly, this effect is economically large and persistent. For example:
- A one standard deviation drop in the federal funds rate in tight labor markets increases subsequent two-year Black employment growth by 0.91 percentage points, women’s employment by 0.39 percentage points, and 0.37 percentage points for workers who did not complete high school.
- This additional impact of monetary policy in tight labor markets is sizable, corresponding to 9% and 18% of the mean employment growth rates for Blacks and high school non-completers over the sample period, respectively.
- Monetary policy’s incremental effects on less-attached workers’ employment growth in tight labor markets holds over time, peaking 7 to 9 quarters after interest rates decrease. (See Figure.)
- Finally, these effects are muted or non-existent for groups with stronger labor market attachment. For example, the point estimate for White employment growth is less than one quarter of the estimate for Blacks and not statistically significant.
This work suggests that sustained expansionary monetary policy, which tightens labor markets, facilitates robust employment growth among less-attached workers. Further, the Federal Reserve’s recent change in its conduct of monetary policy from strict to average inflation targeting should benefit the employment of female, minority, and low skilled workers. At the same time, policy tradeoffs exist, as expansionary monetary policy may increase inflationary pressure and foster wealth inequality by raising asset prices.
-
New medical products make important contributions to improved living standards, and both markets and regulators have the potential to contribute to, or detract from, the innovative process. On the market side there are concerns that competition may erode financial rewards to innovation, or that large, bureaucratic firms may not foster the innovation necessary to develop new products and methods. Meanwhile, government stands as a gatekeeper for new medical products for the stated purpose of protecting consumers.

In terms of government protection, though, one question looms: What are the unintended costs associated with the introduction of regulations? For example, in 1962, Congress passed the “Drug Efficacy Amendment” (EA) to the Federal Food, Drug, and Cosmetic Act, which made proof of efficacy a requirement for the approval of new drugs by the Food and Drug Administration (FDA). Sam Peltzman, Chicago Booth emeritus professor, pioneered cost-benefit analysis of the EA in 1973 by estimating the consumer benefit (if any) of curtailing the sale of ineffective drugs and comparing it to the opportunity cost of effective drugs that were not introduced into the US market due to the additional approval costs created by the EA. Peltzman concluded that the EA imposed a net cost on consumers of magnitude similar to a “5-10 percent excise tax on all prescriptions sold.”
Passage of the EA led to a post-1962 drop in the introduction of new drug formulas, and Peltzman was challenged to quantify the degree to which the foregone drugs would have been ultimately deemed ineffective by consumers and their physicians. In this new work, Casey B. Mulligan analyzes two drug market events between 2017 and 2021 to offer fresh perspectives on the consumer costs and benefits of the entry barriers created by the FDA approval processes.

In the first case, Mulligan employs a conceptual model of prices and entry to quantify the welfare benefits of the deregulation of generic entry that occurred since 2012, without restricting the values of the price elasticity of demand or the level of marginal cost. Mulligan’s review of generic entry data suggests that easing generic restrictions discourages innovation, but that this cost is more than offset by consumer benefits from enhanced competition, especially after 2016.
In his second analysis, Mulligan views the timing of COVID-19 vaccine development and approval through the lens of an excess burden framework to better measure the opportunity cost of regulatory delays, including substitution towards potentially harmful remedies that need not demonstrate safety or effectiveness because they are outside FDA jurisdiction. He finds that the pandemic vaccine approval process, although accelerated during COVID-19, still had opportunity costs of about a trillion dollars in the US for just a half-year delay, and even more costs worldwide.
-
Polling is ubiquitous in US elections, as well as in countries around the world, and for many voters they may seem more noise than information. However, polls serve important functions beyond predicting likely winners; they also establish support rankings during the election, for example, which can have important consequences. In the United States, presidential candidates are invited to speak at nationally broadcast primary debates based on their performance in various polls. Given the importance of these debates in informing voters and in influencing the trajectory of campaigns, the accuracy of polls is paramount. Currently, the rankings for US presidential primary debates are computed using only estimates of the underlying share of a candidate’s support. As a result, there may be considerable uncertainty concerning the true rank.

Practical examples like this motivate the deep statistical and mathematical analysis in this important new paper. In the above example, data on choices, including polls of political attitudes, commonly feature limited sample sizes and/or categories whose true share of support is small. For reasons explained in detail within the paper, these features pose challenges to inference methods justified using large-sample arguments. In contrast, this paper considers the problem of constructing confidence sets for the rank of each category that are valid in finite samples, even when some categories are chosen with probability close to zero.
Very broadly, the authors consider two types of confidence sets (or ranges of values that contain the true value of a given parameter with a specified probability) for the rank of a particular population. One confidence set provides a way of accounting for uncertainty when answering questions pertaining to the rank of a particular category (marginal confidence sets), and the second provides a way of accounting for uncertainty when answering questions pertaining to the ranks of all categories (simultaneous confidence sets). As a further contribution, the authors also develop bootstrap methods to construct such confidence sets.
What does this mean in practice? The authors applied their inference procedures to re-examine the ranking of political parties in Australia using data from the 2019 Australian Election Survey. The authors find that the finite-sample (marginal and simultaneous) confidence sets are remarkably informative across the entire ranking of political parties, even in Australian territories with few survey respondents and/or with parties that are chosen by only a small share of the survey respondents.
To illustrate this point, the authors show that at conventional significance levels, the finite-sample marginal confidence set for the rank of the Green Party contains only rank 4. In contrast, the bootstrap-based marginal confidence sets contain the ranks 3 to 7, thus exhibiting significantly more uncertainty about the true rank of the Green Party.
While details of the authors’ work will certainly engage statistically and mathematically inclined researchers, general readers should also take note of this work. Better polling techniques matter.
-
The authors employ two monthly panel surveys of business executives in the US (about 500 monthly responses) and UK (roughly 3,000) to ask about sales growth at their firms over the past year and for sales forecasts over the next year. Importantly, the forecast questions elicit data for five scenarios—a growth rate in each of the lowest, low, medium, high, and highest sales growth scenarios and the probabilities of each scenario. Thus, the surveys yield a 5-point subjective forecast distribution over one-year-ahead sales growth rates for each firm.
The surveys reveal that the COVID shock pushed average uncertainty among US firms from about 3% before the pandemic to 6.4% in May 2021. Uncertainty fell back to about 4.5% in October 2021. Data for UK firms tell a similar story: Firm-level uncertainty rose from about 4.9% before the pandemic to 8.5% in April 2021 and has since declined to about 6.8%. [The remainder of this Finding is concerned with US survey results; the UK results are very similar, as described in the full paper.]

The US distribution of realized growth rates widened greatly in the wake of the pandemic, as shown in the left panel of the accompanying Figure. Initially, the widening occurred mostly in the lower half of the distribution. For example, the 10th percentile of realized growth rates fell from about -5% in late 2019 to a trough of -35% in May 2020. The 25th percentile shows the same pattern in somewhat muted form. In contrast, growth rates at the 75th and 90th percentiles fell by about 3 percentage points from late 2019 to May 2020. By the summer of 2021, though, the lower tail of the realized growth rate distribution had recovered to pre-pandemic values, while growth rates at the 75th and 90th percentiles had greatly surpassed their pre-pandemic values.
The average subjective forecast distribution over firm-level growth rates in the year ahead shows a similar pattern, as seen in the right panel of the Figure, which captures both average uncertainty in sales growth rate forecasts at the firm level and whether that uncertainty is mainly to the upside, mainly to the downside, or evenly balanced between the two.
When the pandemic took hold in March 2020, firms perceived a large increase in downside uncertainty, placing much greater weight on the possibility of highly negative growth rates. While the 90th and 75th percentiles of the forecast distribution changed little, the median fell by about 5 percentage points and the 25th and 10th percentiles fell by 20 and 40 percentage points, respectively. In short, the average firm saw dramatically more downside risk in year-ahead sales growth rates during the early months of the pandemic.
As the pandemic continued, downside risks abated greatly. By early 2021, the forecast distribution remained highly dispersed (i.e., subjective uncertainty remained high), but it increasingly reflected upside rather than downside risk. In recent months, firm-level subjective uncertainty is mainly about prospects for rapid sales growth over the coming year and only secondarily about the possibility of sharp contractions.
In broad summary: The early months of the pandemic involved a negative first-moment shock, a positive second-moment shock, and a negative third-moment or skewness shock; that is, the pandemic drove a large drop in the first moment of the economic outlook and much higher uncertainty in the form of highly elevated downside risks.
Looking ahead, the authors suggest that uncertainty may revert to pre-pandemic levels as COVID case numbers and deaths fall, social distancing subsides, and policy stimulus fades out. Indeed, many firms see tantalizing possibilities to the upside. Nevertheless, there are significant risks to recovery from ongoing supply-chain disruptions, inflationary pressures, low vaccination rates in many countries, and the potential for new SARS-CoV-2 variants.
-
Since the 1950s, US policymakers have treated unemployment insurance (UI) as a discretionary tool in business cycle stabilization, extending the generosity of benefits in recessions. This was particularly evident during the Great Recession, when benefit durations were raised almost four-fold at the depth of the downturn. While critics emphasized the costly supply-side effects of more generous UI, supporters pointed to potential stimulus benefits of transfers to the unemployed. These issues resurfaced again as policymakers debated the benefits of UI extensions during the COVID-19 pandemic.

Existing research misses the potential interactions between UI and aggregate demand. Most prior work has studied UI in partial equilibrium (which holds much of the economy constant), while analyses in general equilibrium have focused on environments without macroeconomic shocks or in which prices and wages adjust so quickly that they eliminate the effect of aggregate demand on the overall level of production.
This paper analyzes the output and employment effects of UI in a general equilibrium framework with macroeconomic shocks and nominal rigidities (when prices and wages are slow to change). Kekre finds that the effect of UI on aggregate demand makes it expansionary when monetary policy is constrained,
as during recent economic crises when nominal interest rates have been near zero. An increase in UI generosity raises aggregate demand through two key channels: by redistributing income to the unemployed, who have a higher marginal propensity to consume than the employed, and by reducing the need for all individuals to save for fear of becoming unemployed in the future. If monetary policy does not respond to the resulting demand stimulus by raising the nominal interest rate, this raises equilibrium output and employment.By calibrating his model to the U.S. economy during the Great Recession, Kekre reveals an important stabilization role of UI through these channels. He studies 13 shocks to UI duration associated with the Emergency Unemployment Compensation Act of 2008 and Extended Benefits program. With monetary policy and unemployment matching the data over 2008-2014, the observed extensions in UI duration had a contemporaneous output multiplier around or above 1. These effects are pronounced and would impact millions of people: The unemployment rate would have been as much as 0.4pp higher were it not for the benefit extensions.
-
Depression is often characterized by cognitive distortions that lead to lack of self-worth and motivation. Research has described the economic impact of these symptoms on labor markets. However, if depression affects people’s ability to work, it likely also impacts economic activity in other ways. This paper documents correlations between depression and shopping behavior in a household panel survey that links health status and behaviors to shopping baskets.
Understanding the relationship between depression and shopping is important for policymakers who must determine the worth of interventions to alleviate depression. Also, the associations between physical health, addiction, and mental health mean that policymakers need to understand the effectiveness of various interventions to induce healthier eating or to reduce dependence on alcohol and tobacco. Finally, understanding how cognitive dysfunction affects decision making is important for modeling decision makers, who are often assumed to behave as fully informed utility maximizers. Cognitive distortions may lead to decision rules that are not well approximated by standard models; likewise, understanding the relationship between depression and shopping behavior may inform models of decision making.

The authors leverage a unique dataset that combines a large, nationally representative, shopper panel with a detailed survey about health conditions. Data include information about individual shopping trips, with records of purchases using in-home optical scanners. About 45% of the panelist households in the authors’ sample opted to participate in a survey that revealed information on many health conditions and associated treatment decisions. Among other conditions, survey reveals whether respondents identify as suffering from depression, as well as treatment with prescription drugs, over-the-counter drugs, or no drugs.
Consistent with other national data sources, the authors find that depression is common. In any given year, roughly 16% of individuals surveyed report having depression and 34% of households have at least one member suffering from depression. How does this phenomenon impact shopping? The authors find that households with depression:
- Spend about 5% less at grocery outlets than non-depressed households,
- Visit grocery stores less often and convenience stores more often,
- Spend a smaller fraction of their basket on fresh produce,
- Are less likely to purchase alcohol,
- And are more likely to purchase tobacco.
- However, spending on junk food (salty snacks, bakery goods and candy) is not significantly different.
- Importantly, the authors find little change in shopping behavior upon initiation of treatment with antidepressants within households.
The authors explore various explanations for these findings, but related to the motivating questions above, they conclude that the relatively large number of households with depressed members may not be an existential threat to the validity of standard demand models. Also, while their results show robust cross-sectional differences in shopping amounts between depressed and non-depressed households, their finding of a lack of within-household differences may cast doubt that depression causes a large reduction in shopping.
Further, the authors’ analyses of the composition of shopping baskets suggest that there may be some self-medication with tobacco, but the large cross-sectional differences between the composition of shopping baskets on other dimensions between depressed and nondepressed households mostly disappear when looking within households. Finally, worse nutrition through the composition of shopping baskets seems unlikely to be the causal mechanism explaining the documented correlation between physical health and mental health.
-
Nearly 1,600 hospital mergers occurred in the United States from 1998-2017. A large economics literature has studied the impacts of this trend. Much this literature has focused on measuring changes in market power and price effects, though a substantial body of work has also looked at clinical outcomes, while other papers examined impacts on costs. What is missing is an explanation for why these mechanisms work: What is the mechanism(s) by which mergers affect these outcomes?
This paper pulls back the curtain on the inner workings of hospital mergers to answer that question. It does so by leveraging a particularly large and consequential acquisition, an ideal case for this “opening the black box” exercise. This mega-merger involved two of the largest for-profit chains in the United States, comprising over 100 individual hospitals. Focusing on this single merger allowed the authors to benchmark changes against the acquirer’s claims, particularly about the use of certain inputs.

Importantly, and unique to their study, the authors also surveyed the leadership of these hospitals about management processes and strategies to see further inside the organization and how it managed the merger. Finally, the authors observed rich clinical and financial performance metrics that the existing literature on hospital mergers typically studies as outcomes.
The authors’ findings include the following:
- Improving hospital performance through mergers is difficult, as indicated by either metrics of private firm performance or social benefit. Despite having a longstanding strategy and history of growth through acquisition, the acquiring firm had difficulty improving either the financial or clinical performance of the target hospitals, even eight years after acquisition.
- The acquirer failed to improve performance even though the merger led to changes in intermediate inputs that might have seemed to herald success. The acquirer was able to install many new executives in the target hospitals (often coming from the acquirer’s existing hospitals) and drive adoption of a new electronic medical record (EMR) system at target hospitals.
- Several years after the merger, the authors find a great deal of similarity in management practices within the merged hospital network compared to other hospital chains. Despite these organizational changes, there were no substantial improvements in targets’ outcomes. The profitability of the target hospitals did not detectably rise. Prices rose, but so did costs, with little detectable impact on quality of care.
- Patients’ clinical outcomes, particularly survival rates and chances of being readmitted to the hospital, were little changed.
- The only clear change in outcomes due to the merger was in the profitability of the acquiring firm’s existing hospitals, and in a negative direction: relative to other for-profit hospitals, the acquiring firm’s profit rates fell by 3 percentage points after the merger.
The authors speculate that this final finding might reflect the consequences of post-merger shifts in the acquirer’s attention and resources away from its existing operations and toward its newly purchased hospitals.
Acknowledging the need for further research, the authors note a key puzzle of this merger: the organization was financially motivated to change and improve, yet the merger led to no clear benefits in hospital performance. In this way, the effects closely align with existing findings that hospital mergers fail to improve patient care. The authors’ evidence on mechanisms suggests that of all the levers it could have moved to raise performance, the chain exerted its strongest influence on those that were straightforward to implement—new technology and shuffling CEOs—but likely to have little payoff.
Finally, regarding merger policy, the authors’ findings provide a new perspective for antitrust authorities evaluating the claimed efficiencies of mergers. This work shows the value of taking an organizational view that considers the stated aims of the merger, how the firm intends to implement those aims internally, and whether those changes are likely to yield performance improvements. Such an approach could help to evaluate merging parties’ efficiency claims and assess the likelihood they will be realized post-merger.
-
Economic theory in recent decades has coalesced around the idea that human capital, including investments in early childhood education, is key to economic growth. What remains unsettled, though, is the where’s, when’s, and how’s of such investments. For example, parental investments are critical in producing child skills during the first stages of development, with such investments differing across socioeconomic status. While these differences have been consistently observed across space and over time, we know little about their underpinnings.

This paper addresses that gap by examining sources of disparate parental investments and child outcomes to reveal potential mechanisms for improving those outcomes. To do so, the authors developed an economic model that invokes parents’ beliefs about how parental investments affect child skill formation as a key driver of investments. Importantly, they also added empirical evidence through two field experiments that explored whether influencing parental beliefs is a pathway to improving parental investments in young children.
In the first field experiment, over a six-month period starting three days after birth, the authors used informational nudges informing parents about skill formation and best practices to foster child development, and they directed those efforts at parents who fall on the low end of a socioeconomic scale (SES) established in the literature. In the second field experiment, the authors employed a more intensive home visiting program consisting of two visits per month for six months, starting when the child is 24-30 months old.
The authors partnered with ten pediatric clinics predominantly serving low-SES families in the Chicagoland area, and recruited families in medical clinics, grocery stores, daycare facilities, community resource fairs, and other venues across the city. In both experiments, the authors measured the evolution of parents’ beliefs, investments, and child outcomes at several time points before and after the interventions, to find the following:
- There is a clear SES-gradient in parents’ beliefs about the impact of parental investments on child development.
- Disparities matter. Parents’ beliefs predict later cognitive, language, and social-emotional outcomes of their child. For instance, the authors find that beliefs alone explain up to 18 percent of the observed variation in child language skills.
- Parental beliefs are malleable. Both field experiments induce parents to revise their beliefs, and the authors show that belief revision leads parents to increase investments in their child. For instance, the quality of parent-child interaction is improved after the more intensive intervention (and to a smaller extent, after the less intensive intervention), and the authors provide evidence of a causal relationship with changes in beliefs about child development.
- Significantly, the observed impacts on parental investments do not considerably fade for those who participate in the home visiting program (but do fade for those in the lower-intensity experiment).
- Finally, the authors find positive impacts on children’s interactions with their parents in both experiments, as well as important improvements in children’s vocabulary, math, and social-emotional skills with the home-visiting program months after the end of the intervention. These insights are a key part of the authors’ contribution, as they show that changing parental beliefs is a potentially important pathway to improving parental investments and, ultimately, school readiness outcomes.
University of Chicago economists, from Robert Lucas to Gary Becker and James Heckman, have proved instrumental in developing ideas related to human capital and early childhood development. This work extends those contributions to explore the influence of parental beliefs as they pertain to the value of parental investment in a child’s development. In doing so, this research offers key insights for policymakers on the importance of providing information and guidance to parents on the impact of parental investments in children for improving school readiness outcomes. But not all interventions are the same. The authors’ show that more intensive educational programs have roughly twice the impact on beliefs as less intensive interventions.
-
Levels of household debt-to-GDP ratios in emerging countries approached those observed in the United States in the years following the Global Financial Crisis, a trend that began at the turn of the century. Governments played a crucial role in encouraging this increase in credit to households, often implemented with the support of government-controlled banks.

One plausible rationale of government-sponsored credit expansion policies is that they are designed to improve long-term outcomes for individuals by, for example, expanding access to credit to help individuals overcome financial frictions and smooth consumption over time. Additionally, these policies are readily available tools that governments can use to promote consumption, at least temporarily, when the economy declines. Despite the diffusion and magnitude of such policy interventions, there is scarce direct empirical evidence on their effects on individuals’ borrowing and consumption patterns.
This paper addresses this gap by investigating micro-level evidence from Brazil, which experienced a large rise in household debt from the mid-2000s to 2014. This increase, especially during the latter phase that started in 2011, was driven by a large push in credit from government banks. Additionally, Brazil offered the authors an individual-level credit registry covering the universe of formal household debt, from which a representative sample of 12.8% of all borrowers recently became available. Among other features, this data set also contains bank debt composition and credit card expenditures at the individual level, allowing the authors to follow each individual between 2003 and 2016.
The authors’ analysis of this rich data source allows them to document the role of government-controlled banks in the aggregate increase in household debt, and they find that these banks’ policies had a clear effect: In the years after 2011, retail credit from private banks stagnated, while government-controlled banks started lending more aggressively.
Further, the authors find that low financial literacy public sector workers boosted borrowing significantly. At the individual level, it is difficult to find evidence ex post that these same workers benefited from the program. Low financial literacy public sector workers borrowed more from 2011 to 2014, cut consumption by significantly more from 2014 to 2016, and experienced overall lower consumption levels and higher consumption volatility from 2011 to 2016.
While the authors are hesitant to make strong statements about the ex ante optimality of the household credit push by government banks, the evidence suggests that, ex post, the most exposed individuals experienced worse outcomes with regard to consumption.
-
Determining which policies to implement and how to implement them is an essential government task. However, policy learning is complicated by a host of factors, encouraging countries to engage in various policy experiments to help resolve policy uncertainty and to facilitate policy learning. This paper analyzes systematic policy experimentation in China since the 1980s, where the government has systematically tried out different policies across regions and often over multiple waves before deciding whether to roll out the policies to the entire nation.
China is an important case study for two reasons. First, the systematic policy experimentation in China is unparalleled in terms of its depth, breadth, and duration. Second, scholars have argued that policy experimentation was a critical mechanism leading to China’s economic rise over the past four decades. Even so, surprisingly little is understood about the characteristics of such policy experimentation, or how the structure of experimentation may affect policy learning and policy outcomes.

The authors focus on two characteristics of policy experimentation to assess whether it provides informative and accurate signals on general policy effectiveness. First, to the extent that policy effects are often heterogeneous across localities, representative selection of experimentation sites is critical to ensure unbiased learning of the policy’s average effects. Second, to the extent that the efforts of the key actors (such as local politicians) can play important roles in shaping policy outcomes, experiments that induce excessive efforts through local political incentives can result in exaggerated signals of policy effectiveness.
Motivated by questions that address these concerns, the authors collect 19,812 government documents on policy experimentation in China between 1980 and 2020 and construct a database of 633 policy experiments initiated by 98 central ministries and commissions. The authors describe their methodology in detail within the paper, but broadly speaking they link the central government document that outlines the overall experimentation guidelines with all corresponding local government documents to record its implementation throughout the country. They measure numerous characteristics of policy experiments, including ex-ante uncertainty about policy effectiveness, career trajectories of central and local politicians involved in the experiment, the bureaucratic structure of the policy-initiating ministries, the degree of differentiation in policy implementation across local governments, and local socioeconomic conditions.
The authors find the following:
- Policy experimentation sites are substantially positively selected in terms of a locality’s level of economic development, and misaligned incentives across political hierarchies account for much of the observed positive selection.
- Experimental situation during policy experimentation is unrepresentative: local politicians exert strategic efforts and allocate more resources during experimentation that may exaggerate policy effectiveness, and such strategic efforts are not replicable when the policy eventually rolls out to the rest of the country.
- The positive sample selection and unrepresentative experimental situation are not fully accounted for when the central government evaluates experimentation outcomes, which would bias policy learning and national policies originated from the experiments.
Among its important implications, this research offers insights into the fundamental trade-off facing a central government: structuring political incentives to stimulate politicians’ effort to improve policy outcomes, while making sure that such incentives are not exaggerated during the experimentation phase, so that policy learning remains unbiased. Solutions that improve mechanism design could improve the efficiency of policy learning and, likewise, could be of valuable policy relevance and importance.
-
This paper uses the Oregon Health Insurance Experiment (OHIE) and the data the authors collected through in-person interviews, physical exams, and administrative data to estimate the effects of expanding Medicaid availability to a population of low-income adults on a wide range of outcomes, including health care utilization and health. The OHIE assesses the effects of Medicaid coverage by drawing on the 2008 lottery that Oregon used to allocate a limited number of spots in its Medicaid program.
The authors’ previous analyses found that Medicaid increased health care use across settings, improved financial security, and reduced depression, but has no detectable effects on several physical health outcomes. For example, they found that while Medicaid did not significantly change blood sugar control, it did increase the likelihood of enrollees receiving a diagnosis of diabetes by a health professional and the likelihood that they had a medication to address their diabetes. However, it did not affect the prevalence, diagnosis, or treatment of hypertension or high cholesterol.1

These results, coupled with the high burden of chronic disease in low-income populations, raised questions about how Medicaid does or does not affect the management of chronic physical health conditions. This new research explores the care and outcomes for such conditions, focusing on the more than 40 percent of the sample with chronic physical health conditions like high blood pressure, diabetes, high cholesterol, or asthma. The authors both assessed new physical health outcomes and investigated in more detail the management of chronic conditions.
The authors examined biomarkers like pulse, markers of inflammation, and Body Mass Index across the entire study population; assessed care and outcomes for asthma and diabetes; and gauged the effect of Medicaid on health care utilization for individuals with vs. without preexisting diagnoses of chronic conditions. The authors find the following:
Medicaid did not significantly increase the likelihood of diabetic patients receiving recommended care such as eye exams and regular blood sugar monitoring, nor did it improve the management of patients with asthma.
There was no effect on measures of physical health including pulse, obesity, or blood markers of chronic inflammation.
Effects of Medicaid on health care utilization appeared similar for those with and without pre-lottery diagnoses of chronic physical health conditions.
These findings led the authors to conclude that while Medicaid was an important determinant of access to care overall, Medicaid alone did not have significant effects on the management of several chronic physical health conditions, at least over the first two years, though further research is needed to assess the program’s effects in key vulnerable populations.
1 Baicker, K., S. L. Taubman, H. L. Allen, M. Bernstein, J. H. Gruber, J. P. Newhouse, E. C. Schneider, B. J. Wright, A. M. Zaslavsky, A. N. Finkelstein, G. Oregon Health Study, M. Carlson, T. Edlund, C. Gallia & J. Smith (2013) The Oregon experiment — effects of Medicaid on clinical outcomes. N Engl J Med, 368, 1713-22.
-
Monetary policy is often considered the preferred tool to stabilize business cycles because it can be implemented swiftly and because it does not rely on large fiscal multipliers. However, when the effective lower bound (ELB) on nominal interest rates limits the ammunition of conventional monetary policy, alternative policy measures are needed. Enter unconventional fiscal policy, which often uses changes in taxes—in this case, value-added taxes—to influence spending.
Booth’s Michael Weber and colleagues previously investigated unconventional fiscal policy in a 2018 paper (See Research Brief). This new paper analyzes the unexpected announcement of the German federal government on June 3rd, 2020, to temporarily cut the value added tax (VAT) rate by 3 percentage points. The law was in effect from July 1, 2020, through December 31, 2020.

Employing survey methods to address empirical challenges pertaining to consumers’ awareness of the tax changes and, hence, how those changes affected spending (retrospectively perceived pass-through of the VAT cut), the authors find the following:
- The temporary VAT cut led to a substantial relative increase in durable spending: Households with a high perceived pass-through spent about 36% more than those with low or no perceived pass-through.
- Semi- and non-durable spending was higher for households that perceived a high pass-through relative to other households by about 11% and 2%, respectively. That is, the VAT policy effect is increasing in the durability of the consumption good.
- The VAT policy effect, especially for more durable goods, increases over time and is maximal right before the reversal of the VAT rate. Roughly calculated, the authors’ micro estimates translate into an aggregate effect of 21 billion Euros of additional durable spending and of 34 billion Euros of overall consumption spending.
- The combined effect of increased consumption spending and the lower effective VAT tax rate resulted in a revenue shortfall for the fiscal authorities of 7 billion Euros.
- Two groups of consumers (not necessarily overlapping) drive the durable spending response: first, bargain hunters, i.e., households that self-report to shop around, or households that, in a survey experiment, turn out to be particularly price sensitive; second, younger households in a relatively weak financial situation.
- There is no evidence that perceived household credit constraints matter.
- Finally, the stabilization success of the temporary VAT cut is also related to its simplicity. Its effect is not concentrated in households that are particularly financially literate or have long planning horizons for saving and consumption decisions.
This last finding, regarding a VAT cut’s simplicity, contrasts with unconventional monetary policy, which often relies on consumer sophistication.
While the authors take no policy stance on monetary vs. fiscal unconventional policies, they do stress the significance of their findings for policymakers: An unexpected temporary VAT cut operates like conventional monetary policy and can be an effective stabilization tool when unconventional monetary policy, like forward guidance, might be less effective.
-
What does it mean that some wealthy individuals argue for higher taxes for the rich but never volunteer to pay higher taxes on their own? After all, the US federal government allows donations to itself, and there is nothing to stop a wealthy individual from paying as much in taxes as she likes.
This seeming hypocrisy stems from the assertion that preferences for individual giving and preferences for societal redistribution are identical. For example, if people are motivated to satisfy moral obligations based only on the degree of personal sacrifice, then people’s willingness to make a sacrifice through individual giving versus through a more progressive tax could be identical. On the other hand, if people trade off preferences for more equal distribution of resources within groups against their own material self-interest, then in large groups people may be more willing to support a centralized redistributive policy than to engage in individual giving.

Why do people make this distinction? One reason is that a centralized redistributive policy can have a larger impact on the group-wide allocation at the same cost to oneself. In other words, certain types of other-regarding preferences imply that creating equitable social outcomes is analogous to a form of public goods provision, where many could be better off under a policy that requires contribution from all, but few have an incentive to engage in voluntary giving.
To investigate these and other questions, the authors employ an online Amazon Mechanical Turk (MTurk) experiment, consisting of 1,600 participants who made incentivized choices as “rich” players, in groups with an equal number of rich and poor players. The “rich” were endowed with 350 cents and the “poor” were endowed with 10 cents. The authors varied certain dimensions of the decision-making environment. For example, half of the participants were part of small groups of 4 people, whereas the other half were in groups of 200 participants.
The authors also introduced within-subject variation in the types of giving decisions: The first type involved an option for individual giving, with the gift distributed equally among all the poor participants; and the second type involved an individual giving decision where the gift would be assigned to one randomly chosen poor participant, but in such a way that no poor participant received a gift from more than one rich participant. A third type of decision involved the rich participants voting on whether a transfer should be made from all rich participants to all poor participants.
Additionally, the authors varied the cost of transfers so that each participant took part in a total of 9 decisions: 3 decision types x 3 different costs of giving. Finally, the authors varied the framing of individual giving to one participant. In one frame they described the recipient as a “matched partner” while in another frame they described the recipient as a “randomly selected person.” This manipulation was conducted to test the malleability of perceived group size; in particular, to test whether participants who initially started out in larger groups might perceive themselves to be in a small group of two when the recipient is described as a “matched partner,” and thus would be more willing to give.
Following are the authors’ three main findings:
- Participants are significantly more likely to vote for group-wide redistribution than they are to engage in individual giving when the individual gift is designated to be split evenly among all poor participants, or when it is designated to one “randomly selected person.”
- While participants’ propensity to vote for group-wide redistribution does not vary at all with group size, their propensity to engage in individual giving that is not to “a matched partner” declines significantly with group size.
- Participants’ propensity to give to “a matched partner” is statistically indistinguishable from their propensity to vote for group-wide redistribution, both in small and large groups. The significant difference between giving to “a matched partner” versus a “randomly selected person,” combined with the stark group size effects on most forms of individual giving, implies that perceptions of group size are not only a key driver of individual giving but are also malleable.
The authors’ theoretical framework, which offers options beyond the existing literature, can aid future investigations of the types of redistributive mechanisms that can help people implement their taste for redistribution in situations where the desire for voluntary giving is too weak to achieve the equitable outcomes that many desire.
-
The American Families Plan under debate in Congress proposes to eliminate the existing Child Tax Credit (CTC), which is based on earned income, and replace it with a child allowance that would increase benefits to $3,000 or $3,600 per child (up from $2,000) and make the full credit available to all low- and middle-income families, regardless of earnings or income. In effect, the CTC would transition from a worker-based benefit to a form of guaranteed income. The authors estimate the labor supply and anti-poverty effects of this policy using the Comprehensive Income Dataset—which links survey data from the U.S. Census Bureau with an unprecedented set of administrative tax and government program data—thus producing more accurate estimates than previous studies.

Initially ignoring any behavioral response, the authors estimate that expansion of the CTC would reduce child poverty by 34% and deep child poverty by 39%. The cost for such a program would reach over $100 billion, which exceeds spending on food stamps and the Earned Income Tax Credit (EITC). Given its universal nature, the new CTC would expand beyond the low-income families targeted under current means-tested programs, including the EITC.
The estimated reductions in child poverty could be threatened due to weakened work incentives under the proposed CTC. For example, under the existing CTC, a working parent with two children receives $2,000 if she earns $16,000 and $4,000 if she earns over $30,000. Under the new plan, a parent with two children would receive between $6,000 and $7,200, regardless of whether she works. Pivoting from a work-based to a universal benefits program raises an important question: How many parents will leave the work force because of diminished work incentives?

To answer this key labor supply question, the authors rely on estimates of the responsiveness of employment decisions to changes in the return to work from the academic literature and mainstream simulation models. They find that replacing the existing Child Tax Credit with a child allowance would lead approximately 1.5 million working parents to exit the labor force. Most of this decrease derives from the elimination of work incentives; for example, the return to work is reduced by at least $2,000 per child for most workers with children. In this regard, the existing CTC provides work incentives on par with the EITC; eliminating the existing CTC would reduce employment by 1.3 million jobs on its own. Further, the new child allowance would reduce employment by an additional 0.14 million jobs because people work less when they have more income.
These findings contrast with a 2019 study by the National Academy of Sciences, which estimated that replacing the CTC with a child allowance would have little effect on employment. This study, though, did not account for the elimination of the existing CTC’s work incentives, even though the study did account for similar incentives when studying an expansion of the EITC.
Ultimately, when accounting for the substantial exit from the labor force due to the proposed CTC, the positive impact on poverty reduction diminishes greatly: The replacement of the existing CTC with a child allowance program would reduce child poverty by just 22%, and deep child poverty would no longer fall.
-
Recent research has documented that, across societies, individuals widely misperceive what others think, what others do, and even who others are. This ranges from perceptions about the size of immigrant population in a society, to perceptions of partisans’ political opinions, to perceptions of the vaccination behaviors of others in the community.
To synthesize this research, the authors conducted a meta-analysis of the recent empirical literature that examined (mis)perceptions about others in the field. The authors’ meta-analysis addresses such questions as: What do misperceptions about others typically look like? What happens if such misperceptions are re-calibrated? The authors reviewed 79 papers published over the past 20 years, across a range of domains: economic topics, such as beliefs about others’ income; political topics, such as partisan beliefs; and social topics, such as beliefs on gender.

The authors establish several stylized facts (or widely consistent empirical findings), including the following:
- Misperceptions about others are widespread across domains, and they do not merely stem from measurement errors. This measure of misperceptions requires that perceptions about others are elicited, and the corresponding truth is known. The truth can be either of an objective or a subjective nature. For example, perceptions of a population’s racial composition have an objective truth, that is, the population shares of each race groups as reported in census data. For perceptions of other people’s opinions, the truth refers to the relevant populations’ reported opinions (for example, the average level of the opinions). These requirements limit the perceptions included in the analyses to those with a measurable and measured truth. (See accompanying Figure.)
- Misperceptions about others are very asymmetric; in other words, beliefs are disproportionately concentrated on one side relative to the truth. The authors ask: Are incorrect beliefs that constitute the misperceptions about others symmetrically distributed around the truth? They define asymmetry of misperceptions as the ratio between the share of respondents on one side of the truth and that on the other side, with the larger share always serving as the numerator and the smaller share as the denominator, regardless of whether the corresponding beliefs are underestimating or overestimating the truth. Thus, a ratio of 1 indicates exact symmetry, and the higher the ratio, the larger is the underlying asymmetry. As the paper describes in detail, overall misperceptions about others are asymmetrically distributed, and such asymmetry is large in magnitude.
- Misperceptions regarding in-group members are substantially smaller than those regarding out-group members. The authors find that among more than half of the belief dimensions, more respondents hold correct beliefs about their in-group members than about out-group members. Moreover, beliefs about out-group members tend to exhibit greater spread across respondents than that about in-group members, suggesting that perceptions about in-group members are not only more accurately calibrated on average, but also more tightly calibrated around the truth. Also, the authors find that perceptions about in-group members are much more symmetrically distributed around the truth than that about out-group members.
- One’s own attitudes and beliefs are strongly, positively associated with (mis)perceptions about others’ attitudes and beliefs on the same issues. Respondents overwhelmingly tend to think that other in-group members share their characteristics, attitudes, beliefs, or behaviors, while those in the out-groups are opposite of themselves.
- Experimental treatments to re-calibrate misperceptions generally work as intended. The authors find that treatments which are qualitative and narrative in nature tend to have larger effects on correcting misperceptions. Also, while some treatments lead to important changes in behaviors, large changes in behaviors often only occur in studies that examine behavioral adjustments immediately after the interventions, suggesting a potential rigidity in the mapping between misperceptions and some behaviors. For example, even though stated beliefs may have changed, the deeper underlying drivers of behavior have not. In practice, this could mean that correcting for one misperception (for example, immigrants “steal”), may not negate all negative views (immigrants “steal” jobs).
The authors stress that many open questions remain in this field of research, including how to identify sources of misperceptions, how to successfully attempt recalibration, and how to account for the welfare implications of misperceptions and their corrections.
-
Employment discrimination is a stubbornly persistent social ill, but to what extent is discrimination a systemic problem afflicting distinct companies? This new research answers this question by studying more than 83,000 fictional applications to over 11,000 entry-level jobs across 108 Fortune 500 employers—the largest resume correspondence study ever conducted. The researchers randomized applicant characteristics to isolate the effects of race, gender, and other legally protected characteristics on employers’ decisions to contact job seekers.

By applying to many jobs across the country, the researchers identified systemic, nationwide patterns of discrimination among companies. Their findings include:
- Black applicants received 21 fewer callbacks per 1,000 applications than white applicants. The least-discriminatory employers exhibited a negligible difference in contact rates between white and Black applicants, and the most-discriminatory employers favored whites by nearly 50 callbacks per 1,000 applications. The researchers find that the top 20% of discriminatory employers are responsible for roughly half of the total difference in callbacks between white and Black applicants in the experiment.
- While there is no average difference in the rates at which employers contacted male and female applicants, this result masks very large differences for different employers, with some firms favoring men and others favoring women. Firms that are most biased against women contact 35 more male than female applicants per 1,000 applications, while the firms that are most biased against men contact about 30 more female than male applicants per 1,000 applications.
- Discrimination against Black applicants is more pronounced in the auto services and retail sectors, while discrimination against women is more common in the wholesale durables sector, and discrimination against men is more prevalent in the apparel sector. Discrimination is less common among federal contractors, which are subject to heightened scrutiny concerning employment discrimination.
- Finally, the study finds that 23 individual companies can be classified as discriminating against Black applicants with very high statistical confidence. These firms are responsible for 40% of total racial discrimination in the study. These companies are over-represented in auto services and in the retail sector. Remarkably, 8 of the 23 firms are federal contractors. One large apparel firm is found to discriminate both against Black applicants and against male applicants.

The study demonstrates that discriminatory behavior is clustered in certain firms and that the identity of many of these firms can be deduced with high confidence. Like the discovery of a gene signaling a predisposition to disease, the news that any firm exhibits a nationwide pattern of discrimination is disappointing but offers a potential path to mitigation. The results of this study may be used by regulatory agencies such as the Office of Federal Contract Compliance or the Equal Opportunity Employment Commission to better target audits of compliance with employment law, and by the firms themselves to promote more equitable and inclusive hiring processes. Diagnosis is the first step on the road to prevention.
-
The signature change in social policy of the past thirty years was the passage of the 1996 Personal Responsibility and Work Opportunity Reconciliation Act (PRWORA) and the other policies that emphasized work-based assistance such as the expansion of the Earned Income Tax Credit (EITC) and Medicaid, and increased support for childcare, training, and other services. While these changes were associated with a dramatic fall in welfare receipt and increases in work and earnings among single mothers, one important question lingers: How have poverty and income levels responded to these policy changes, especially among the most vulnerable?


To answer this and related questions, the authors analyze changes in material well-being between 1984 and 2019, focusing on the period starting in 1993 with the welfare waivers that preceded PRWORA. For single mother headed families—the primary group affected by the changes in tax and welfare policy—the authors analyze changes in income and consumption and other measures of well-being. Consumption offers advantages over income as a measure of economic well-being, in part because of underreporting of income in surveys. The authors also focus on different parts of the distribution of income and consumption, particularly the very bottom, because policy changes are likely to have very different effects at different points in the distribution.
The authors find the following:
- While some mothers undoubtedly fared poorly after welfare reform, the distribution shifted in favorable ways. The consumption of the lowest decile of single mother headed families rose noticeably over time and at a faster rate than those higher up in the consumption distribution.
- Indications of improved well-being are evident in measures of expenditures on housing, food, transportation, and utilities, as well as in housing characteristics and health insurance coverage.
- The material circumstances of single mothers especially affected by welfare reform have also improved relative to plausible comparison groups. Median consumption of low-educated single mothers rose relative to that of low-educated childless women and married mothers, and relative to high-educated single mothers.
- This evidence during the period of the policy changes of the 1990s suggests that a combination of a reduction in unconditional aid and an expansion of aid conditional on work (with exceptions for those who could not work) was successful in raising material well-being for single mothers.
The authors stress that these findings, which contrast sharply with data based on survey-reported income, are not the whole story when it comes to the material circumstances of single mothers and their families. For example, policy changes may have adversely, or positively, affected time spent with children, health, educational investments, outcomes for children, or other important outcomes. It is also important to note that this evidence of improved economic circumstances does not imply that the level of economic well-being for single mothers is high. Rather, the families that are the focus of this study have very few resources; average total annual consumption for a single mother with two kids in the bottom decile of the consumption distribution is about $14,000 in 2019.
-
The average share of the world’s population above 50 years old has increased from 15% to 25% since the 1950s and is expected to rise to 40% by the end of the twenty-first century (see Panel A of the accompanying Figure). There is consensus that an aging population saves more, helping to explain why wealth-to-GDP ratios have risen and average rates of return have fallen (Panels B and C). Also, insofar as this mechanism is heterogeneous across countries, it can further explain the rise of global imbalances (Panel D).

Beyond this qualitative consensus lies substantial disagreement about magnitudes. For instance, structural estimates of the effect of demographics on interest rates over the 1970–2015 period range from a moderate decline of less than 100 basis points to a large decline of over 300 basis points. Some structural economic models predict falling interest rates going forward, while an influential hypothesis focused on the dissaving of the elderly argues aging will eventually push savings rates down and interest rates back up. This argument, popular in the 1990s as the “asset market meltdown” hypothesis, was recently revived under the name “great demographic reversal.”
This work refutes the great demographic reversal hypothesis and shows that, instead, demographics will continue to push strongly in the same direction, leading to falling rates of return and rising wealth-to-GDP ratios. The authors find that the key force is the compositional effect of an aging population: the direct impact of the changing age distribution on wealth-to-GDP, holding the age profiles of assets and labor income fixed. In the authors’ model, this determines the path of wealth-to-GDP in a small open economy, as well as interest rates and global imbalances in a world economy.
The authors project out the compositional effect of aging on the wealth-to-GDP ratio of 25 countries until the end of the twenty-first century. This effect is positive, large, and heterogeneous across countries. According to the authors’ model, this will lead to capital deepening everywhere, falling real interest rates, and rising net foreign asset positions in India and China financed by declining asset positions in the United States. This approach, based on stocks (i.e. wealth-to-GDP) rather than flows (i.e. savings), shows why there will be no great demographic reversal.
-
Researchers have long examined how market concentration interacts with lender screening in credit markets. The efficiency of lending markets, for example, can be hampered by information imperfections, but such harmful effects can be in part mitigated by imperfect competition. The authors propose and test a new channel through which competition can have adverse effects on consumer credit markets.
This may seem counterintuitive. How can credit market competition lead to consumer harm? Imagine that lenders can invest in a fixed-cost screening technology that screens out consumers who are likely to default, allowing lenders to charge lower interest rates to the remaining consumers. Lenders in concentrated markets have higher incentives to invest in screening, since their fixed costs are divided among a larger customer base. As a result, when market competition increases, lenders have lower incentives to invest in screening. The population of borrowers becomes riskier, and interest rates can increase, leaving consumers worse off.

The authors develop a model of competition in consumer credit markets with selection and lender monitoring, which shows that, in the presence of lender monitoring, the effect of market concentration on prices depends on the riskiness of borrowers. In markets with lower-risk borrowers, the authors find a standard classical relationship: more competition leads to lower prices. However, in markets with a greater portion of high-risk borrowers, increased competition can actually increase prices.
The authors provide empirical support for the model’s counterintuitive predictions through an examination of the auto loan market to reveal that, indeed, in markets with high-risk borrowers, increased competition is associated with higher prices.
These findings have implications for competition policy in lending markets. Competition appears not to improve market outcomes in subprime credit markets, so antitrust regulators may want to allow some amount of concentration in these markets. The authors’ results also suggest, though, that there is some degree of inefficiency in the industrial organization of these markets: firms appear to make screening decisions independently, even though there are returns to scale in screening. Better outcomes are possible at lower costs if firms could pool efforts in developing screening technologies. The authors suggest that developments in fintech, such as the rise of alternative data companies, could eventually improve the efficiency of screening in these markets.
-
Many observers point to India’s Industrial Disputes Act (IDA) of 1947 as an important constraint on growth. The IDA requires firms with more than 100 workers that shrink their employment to provide severance pay, mandatory notice, and obtain governmental retrenchment authorization. The IDA thus potentially constrains growth in two ways. First, the most productive Indian firms are likely sub-optimally small. Likewise, the Indian manufacturing sector is characterized by many informal firms, a small number of large firms, and a high marginal product of labor in large firms. Second, the higher costs faced by large firms in retrenching workers may dissuade them from undertaking risky investments to expand, one of the possible forces behind the low life-cycle growth of Indian firms.

The authors reveal that the constraints on large firms have diminished since the early 2000s, even though there has been no change in the IDA, and they offer visual evidence in the accompanying Figure. The left panel shows that the thickness of the right tail of formal Indian manufacturing increased between 2000 and 2015. The right panel shows that average value-added/worker is increasing in firm employment in 2000 and 2015, but this relationship is more attenuated in 2015 compared to 2000, particularly for firms with more than 100 workers. If the marginal product is proportional to the average product of labor, and profit-maximizing firms equate the marginal product of labor to the cost of labor, then this suggests that the effective cost of labor has diminished for larger Indian firms compared to smaller firms.
What happened in the early 2000s to effect these changes? The authors argue that the decline in labor constraints faced by large Indian firms since the early 2000s is driven by firms’ increasing reliance on contract workers hired via staffing companies. The IDA only applies to a firm’s full-time employees; contract workers are not the firm’s employees for the purposes of the IDA. The contract workers are employees of the staffing companies, and the staffing companies themselves must abide by the IDA. This loophole provides customer firms with the flexibility to return the contract workers to the staffing company without violating the IDA.
What was special about the early 2000s that caused an explosion of contract labor in India, when a legal framework for the deployment of contract labor was in place since the 1970s? The authors argue that a 2001 Indian Supreme Court decision paved the way for large firms to increasingly rely on contract labor. Prior to this decision, it was unclear whether firms who were caught improperly using contract workers would have to absorb them into regular employment, which plausibly made large firms reticent to rely on contract labor. The 2001 Supreme Court decision clarified that this was not the case, leading to a discrete change in the use of contract workers by large firms, in the employment share of large firms, and in the gap in labor productivity between large and small firms after 2001. In addition, these changes were more pronounced in pro-worker states and for firms with better access to staffing firms prior to the decision.
-
This new research addresses long-standing questions about technology adoption in businesses by examining how credit scoring technology was incorporated into retail lending by Indian banks since the late 2000s. In contrast to developed countries such as the United States, where credit bureaus and credit scoring have been around for several decades, credit bureaus obtained legal certitude in India only around 2007.
Using microdata on lending, the authors analyze the differences in the pace of adoption of this new technology between the two dominant types of banks in India: state-owned or public sector banks (PSBs), and “new” private banks (NPBs), relatively modern enterprises licensed after India’s 1991 liberalization. Together, these banks account for approximately 90 percent of banking system assets over the authors’ research period.

For both types of banks, the use of credit bureaus was not only a new and unfamiliar practice, but their value was unclear, especially because Indian credit bureaus are subsidiaries of foreign entities, with short operating histories in India. The authors posited that any differences in adoption practices would be evident between PSBs and NPBs. And that is what they found. Their analysis of loans, repayment histories, and credit scores from a database of over 255 million individuals reveals the following, among other findings:
- Banks still make many loans without bureau credit checks, even for customers for whom score data are available. Interestingly, the lag in using credit bureaus is concentrated in the PSBs. At the end of the sample period in 2015, PSBs check credit scores for only 12% of all loans compared to 67% for NPBs. These differences hold when the authors control for mandated government loans that may skew PSB practices.
- The gap in bureau usage depends on the type of the customer seeking a loan. For new applicants, PSBs inquired about 95% or more of new customers before making them a loan, about the same as the ratio for NPBs.
- On the other hand, PSBs are much less willing to use the new technology for application from prior borrowers. For these borrowers, the authors find a significant gap even in 2015, the last year of their sample, in which only 23.4% of new PSB loans to prior borrowers were made after inquiry, compared to 71.9% of loans for NPBs.
- PSBs’ reluctance to make credit inquiries is not because credit score data are unhelpful. Such data are reliably related to ex-post delinquencies. Further, the authors show that the greater use of credit scores by PSBs would reduce the delinquency of prior borrowers significantly, more than halving the baseline delinquency rate.
- Why do loan officers not inquire and obtain credit scores? The authors provide evidence that the hard data returned through inquiries tend to constrain loan officers’ freedom to lend. If allowed discretion on whether to inquire, loan officers prefer to not inquire their prior clients so as to be able to favor them with loans.
- Why do banks continue to allow loan officers discretion if it is suboptimal today? The authors show that in allowing discretion, PSBs may be continuing a practice that was optimal in the past. Specifically, regulations in the past forced PSBs to maintain extensive and widespread rural networks (NPBs came later and were not subject to these regulations). At that time, it was simply not possible to micro-manage lending in such networks from the center, given the difficulty of communication, and the paucity of hard data. It was optimal to allow branch managers and loan officers discretion.
- Even though it is much easier to communicate with remote branches today and exchange data, these banks continue the past practice of allowing loan officers discretion (perhaps because their loan officers do not want to give it up). The consequence is that the new credit scoring technology is not optimally used by PSBs.
This research suggests that past managerial practices can stand in the way of technology adoption, especially if it involves managers giving up a source of power and patronage. However, the authors also find that technology dominates … eventually.
-
The lack of demographic diversity in the composition of important policy committees such as the Federal Open Market Committee (FOMC) at the US Federal Reserve or the European Central Bank’s Governing Council has raised questions about equity and fairness in the policy process. Beyond equity and fairness, advocates also argue that more diverse committees reflect more viewpoints and experiences, which may lead to better decisions. Furthermore, diverse committees may be better able to relate to and talk to many different communities.

But how to measure such effects? To overcome long-standing empirical challenges, the authors built on a large body of research in social psychology and cultural economics to design an information-treatment randomized control trial (RCT) on a representative survey population of more than 9,000 US consumers. Subjects read the FOMC’s medium-term macroeconomic forecasts for unemployment or inflation with the randomized inclusion of one of three faces of FOMC members (and regional Fed presidents): Thomas Barkin (White man), Raphael Bostic (Black man), and Mary Daly (White woman).
In a separate survey, the authors verified the effectiveness of this experimental intervention, in that exposure to the Black or female committee member induces subjects of all demographics, on average, to perceive a higher presence of these traditionally underrepresented groups on the FOMC. The authors’ main test compares the subjective macroeconomic expectations of consumers who belong to the same demographic group and who see the same forecast but for whom FOMC diversity salience varies. Their findings include:
- Consumers belonging to underrepresented groups who are randomly exposed to a female or Black FOMC member on average form macroeconomic expectations, especially on unemployment, closer to the FOMC forecasts. For example, 52%-56% of White female subjects form expectations within the range of the FOMC’s unemployment forecasts if the presence of a White woman or a Black man on the FOMC are salient, relative to 48% if the presence of a White man is salient, and 32% when they do not receive any forecast. Effects are even stronger for Black women.
- For Black men, effects are smaller but indicate a stronger reaction when Raphael Bostic’s presence on the FOMC is salient.
- The expectations of Hispanic respondents who are not represented on the FOMC and of White men do not respond differentially to the three committee members. White men’s non-reaction implies increasing diversity representation does not move the expectations of the overrepresented group away from the FOMC forecast.
- For inflation expectations, the FOMC inflation forecasts affect all subjects’ beliefs, and the differential effects based on exposure to diversity are weaker, consistent with the fact that realized inflation varies little by demographic groups, contrary to the unemployment rate.
The authors also measure trust in the Fed’s ability to adequately manage inflation and unemployment, as well as whether the Fed acts in the interest of all Americans. Both forms of trust correlate significantly with subjects’ propensity to form expectations in line with the FOMC’s forecasts. Furthermore, underrepresented subjects are substantially more distrustful of the Fed in the control treatment that did not receive any forecast and did not see the picture of any policymaker. By contrast, female and Black subjects become significantly less distrustful when the presence of Mary Daly or Raphael Bostic on the FOMC is salient. Again, no offsetting negative effect on the trust of White male subjects exists, so that overall trust in the Fed increases in these treatments.
In a follow-up study to further assess the impact of diversity salience, the authors successfully contacted about one-third of the original subjects and had them read one of two articles featuring a statement about the US economy from a high-ranked policymaker, either from the Congressional Budget Office (CBO) or the Federal Reserve. Subjects were randomized into three groups where (a), the policymakers were not named; (b) both (named) policymakers were men; and (c), subjects had the choice between the same CBO male and a Fed female policymaker. The authors find that female subjects in the third group are significantly more likely to choose the article about the Fed than female subjects in the other two groups, whereas male subjects choose similarly across treatments. Higher policy committee diversity might thus increase underrepresented groups’ willingness to acquire information about monetary policy.
-
Recent work by Barrero, Bloom, and Davis revealed that working from home, a phenomenon that rose to ten times pre-COVID levels in spring 2020, will endure post-pandemic (see “Why Working From Home Will Stick” for the Economic Finding and a link to the working paper). The ability to work from home (WFH), and the quality of such work, is influenced by the quality of internet service, and in this paper the authors explore the impact of internet service on previous and likely future WFH experience, earnings inequality, and the psychological benefits of video conferencing in times of social distancing, among other issues.

To address these questions, the authors tap multiple waves of data from the Survey of Working Arrangements and Attitudes1 (SWAA), an original cross-sectional survey, fielded monthly since May 2020, and thus far collecting 43,000 responses from working-age Americans who earned at least $20,000 in 2019. The survey asks about working arrangements during the pandemic, internet access quality, productivity, subjective well-being, employer plans about the extent of WFH after the pandemic ends, and more. The SWAA measure of working from home does not encompass workdays split between home and office or work at satellite business facilities.
In their earlier work, the authors estimated that a re-optimization of working arrangements in the post-pandemic economy would boost productivity by 4.6% relative to pre-pandemic levels, mainly attributable to savings in commuting time. This boost reflects a combination of higher productivity when WFH for some workers and the selected nature of who works from home in the post-pandemic economy.

However, what would happen if everyone had access to high-quality internet service? This new work approaches this question by asking people directly about the effect that such service would have on their productivity. The authors also employed regression models that relate SWAA data on the relative productivity of WFH to internet access quality. Under both approaches, they exploit SWAA data on employer plans for who will work from home in the post-pandemic economy, and how much. Their findings include:
- Moving to high-quality, fully reliable home internet service for all Americans (“universal access”) would raise earnings-weighted labor productivity by an estimated 1.1% in coming years.
- The implied output gains are $160 billion per year, or $4 trillion when capitalized at a 4% rate. Estimated flow output payoffs to universal access are nearly three times as large in COVID-like disaster states, when many more people work from home.
- Better home internet access increases the propensity to work from home. Universal access would raise the extent of WFH in the post-pandemic economy by an estimated 0.7 percentage points, which slightly raises the authors’ estimate for the earnings-weighted productivity benefits of moving to universal access.
- Better home internet service during the pandemic is also associated with greater subjective well-being, conditional on employment status, working arrangements, and other controls.
- While intuition suggests that improving internet access for lower-income workers would reduce inequality, the authors find that planned levels of WFH in the post-pandemic economy rise strongly with earnings. This effect cuts the other way. On net, they find that universal access would be of little consequence for overall earnings inequality and for the distribution of average earnings across major demographic groups.
The authors stress that the desirability of moving part or all the way to universal access depends on the costs as well as the benefits. Also, this work reveals the extra economic and social benefits of universal access during the pandemic and underscores its resilience value in the face of disasters that inhibit travel and in-person interactions—an important but understudied topic.
This paper was prepared for the Economic Strategy Group at the Aspen Institute.
1See wfhresearch.com
-
Individuals seeking information about government programs often experience a paucity of customer support and an onerous application process, according to recent reports, adding additional hurdles to already vulnerable populations. These concerns have been heightened during the COVID-19 lockdowns as, for example, more than 68 million people have applied for unemployment insurance (UI) from March 15, 2020, to December 26, 2020.

There are many potential measures of customer support for such government services as UI, Medicaid, and Supplemental Nutritional Assistance Program (SNAP, formerly known as food stamps) as well information regarding income taxes. The authors use a mystery shopping approach to make 2,000 phone calls to states around the country and document the probability of reaching a live representative with each call. Their findings include the following:
- Significant variation across states and government programs. For example, in Georgia and New Jersey, less than 20% of phone calls resulted in reaching a live representative whereas in New Hampshire and Wisconsin over 80% of calls were answered.
- On average across all states, live representatives were easier to reach when looking for help with Medicaid or income tax filing relative to SNAP or UI.
- Importantly, the authors find that states where individuals had more success finding a live UI representative were the same states where a live representative was more likely reached for other government services. This suggests that some states are better or worse across all agencies.
- Finally, the authors do not find evidence that states compensated for lack of live phone representatives by providing better websites or online chat features.

As noted above, a significant number of Americans filed UI claims during the pandemic, often struggling with inefficient call systems that place additional obstacles to receiving timely aid. The authors’ results show that there is significant variation across states in the ability to reach live representatives for UI claims and three other programs; states that have inefficient UI call systems also struggle with call systems for the other programs. The authors express hope that such research can provide more accountability for state governments to improve customer support and to better deliver services to constituents in need.
-
How do Americans respond to receiving an unexpected financial windfall or, in economic parlance, an idiosyncratic and exogenous change in household wealth and unearned income? For example, do they work less? And how much of the windfall do they spend? The answers to these and other questions matter as policymakers consider the income and wealth effects of policies ranging from taxation to a universal basic income (UBI).
Researchers have long struggled to find variation in wealth or unearned income that is both as good as random and specific to an individual as opposed to economy- wide. Such variation is necessary to isolate the effects of changes in wealth or unearned income, holding fixed other determinants of behavior such as preferences and prices. The authors address this challenge by analyzing a wide range of individual and household responses to lottery winnings between 1999 and 2016, and then exploring the economic, and policy, implications.
Their primary findings are three-fold:
- First, the authors find significant and sizable wealth and income effects. On average, an extra dollar of unearned income in a given period reduces pre-tax labor earnings by about 50 cents, decreases total labor taxes by 10 cents, and increases consumption by 60 cents. These effects differ across the income distribution, with households in higher quartiles of the income distribution reducing their earnings by a larger amount.
- Next, the authors develop and apply a rich life-cycle model in which heterogeneous households face non- linear taxes and make earnings choices both in terms of how many people work (extensive margin) and how much a given number of people work, on average (intensive margin). By mapping their model to their estimated earnings responses, the authors obtained informative bounds on the impacts of two policy reforms: an introduction of UBI and an increase in top marginal tax rates.
- Finally, this work analyzes how additional wealth and unearned income affect a wide range of behavior, including geographic mobility and neighborhood choice, retirement decisions and labor market exit, family formation and dissolution, entry into entrepreneurship, and job-to-job mobility.
 As an example of this work’s insight into policymaking, the authors’ comprehensive and novel set of analyses demonstrates that the introduction of a UBI will have a large effect on earnings and tax rates. Even if one abstracts from any disincentive effects from higher taxes that are needed to finance a UBI, each dollar will reduce total earnings by at least 52 cents and require an increase in tax rates that is roughly 10 percent higher than what would have been in the absence of any behavioral earnings responses. For example, given average household earnings of roughly $50,000, a UBI of $12,000 a year would reduce average household earnings by more than $6,000 and require an earnings surcharge of approximately 27 percent on all households, out of which 2.5 percentage points is due to the behavioral response.
Another example of this work’s application reveals the effect of a financial windfall on people’s decision to move. Winning a lottery leads to an immediate, one-off increase in the annual moving rate of approximately 25 percent. Lower-income households, younger households, and renters constitute the groups that are most responsive t a change in wealth in terms of geographic mobility. One striking finding is that households do not systematically move to neighborhoods that are typically-measured (using local-area opportunity indices, poverty rates, and educational attainment) as having higher quality. This is true even for parents with young kids. This finding indicates that pure unconditional cash transfers do not lead households to systematically move to locations of higher quality, suggesting that non-financial barriers must play a big role.
-
Researchers have long investigated the effects of business cycles on households, with findings ranging from little effect on social welfare (or welfare costs) to more significant effects, including with variation across households. However, according to this new paper, focusing on shocks related to business cycle fluctuations masks a key point: all idiosyncratic shocks matter, and those unrelated to business cycles matter a great deal. These idiosyncratic shocks can come in the form of, for example, the death of a prime wage earner or a sudden job layoff unrelated to a recession, such as the recent pandemic.

To the point, Constantinides estimates that the benefits of eliminating idiosyncratic shocks to consumption unrelated to the business cycle are 47.3% of the utility of a member of a household. This may be more concretely characterized by saying that the welfare gain is equivalent to that associated with an increase in the path of a consumer’s level consumption by 47.3%, state by state, date by date. By contrast, the benefits of eliminating idiosyncratic shocks to consumption related to the business cycle are 3.4% of utility and the benefits of eliminating aggregate shocks are 7.7% of utility.
Broadly described, Constantinides derives these estimates by:
- distinguishing between idiosyncratic shocks related to the business cycle and shocks unrelated to the business cycle,
- recognizing that idiosyncratic shocks are highly negatively skewed,
- calibrating welfare benefits via a model using household-level consumption data from the Consumer Expenditure Survey,
- explicitly targeting moments of household consumption,
- assuming that households are responsive to
long-run risks, - and incorporating relevant information from the market.
These new estimates on the effect of idiosyncratic shocks are substantially higher than earlier estimates and should give policymakers pause. Constantinides argues that policymakers should focus on how they can insure households against idiosyncratic shocks unrelated to the business cycle. This is not to say that policies which address aggregate consumption, that is, enacting monetary and fiscal policy in reaction to a recession, do not matter; of course, they do, and this work finds that such policies likely matter more than previously understood. What this work finds, though, is that the welfare benefits of eliminating idiosyncratic shocks unrelated to the business cycle are much higher—the Coronavirus Aid, Relief, and Economic Security (CARES) Act being a case in point.
By way of example, see the accompanying figure for estimates of the impact on household financial viability following passage of the CARES Act, which was signed into law in March 2020 to address the economic shock of the COVID-19 pandemic. This figure reveals the many US households, especially at lower income levels, that would have lost financial viability relatively quickly without the relief provide by the CARES Act.
-
For the investor hoping to insure her investments against possible risks, the list of hazards is nearly limitless. She might worry about risks stemming from climate change, political instability, health care crises like pandemics, wild swings in GDP growth, and a host of others. To hedge against such shocks, an investor might tailor her portfolio by making investments that, in effect, insure against specific risks. For example, an investor that is worried about climate risks will look for investments that increase in value when climate risks materialize.
One natural way to buy insurance against specific risks is to use derivative markets. For example, an investor worried about inflation can buy so-called “inflation swaps” that specifically target inflation. For many risks, however, there are no derivative markets that investors can directly access. For example, there isn’t a clear market where one can insure against climate risks.
If derivative markets are not available, investors can still try hedging the risks by building portfolios that provide similar insurance out of assets that are actually tradable (like equities). There are two fundamental obstacles in doing so:
First, building a portfolio of equities that insures against a particular risk, and only that particular risk, requires taking a stand on what other risks are important to investors. This allows the investor to focus on only the risk they are interested in hedging.
Second, it requires the assets that one wants to use to build the portfolio to actually be substantially exposed to those risks. As an example, one can easily build a portfolio that hedges climate risks if one can identify assets that are highly exposed to it (e.g., green companies that do well when the climate deteriorates). In other cases, however, this is more difficult; for example, one may want to insure against fluctuation in aggregate consumption, but most stocks are only weakly related to this risk, so the hedging portfolio will have poor hedging properties.
New research by Stefano Giglio, Dacheng Xiu, and Dake Zhang, which builds on earlier work, offers a methodology that aims to address both issues by exploiting the benefits of dimensionality. They show that even if the true risk factors that drive asset prices are not known, statistical techniques (principal component analysis) can be used to extract from a large panel of returns from a set of factors that help isolate the risk of interest (e.g., climate risk) from all other risk factors.
In addition, and most importantly, the methodology also addresses the issue of weak exposure of the assets to the factor of interest. The idea is simple: identify – using statistical methods – among the universe of assets those assets that are most exposed to the risk of interest. For example, in the case of aggregate consumption, the methodology will identify those stocks that have historically exhibited high co-movement with consumption. The hedging portfolio will then use only those, more informative, assets. All other stocks are discarded.
More generally, the authors argue that the strength or weakness of a risk factor, that is, whether many assets or only a few are exposed to that risk, should not be viewed as a property of the factor itself; rather, it should be viewed as a property of the set of test assets used in the estimation. As another example, a liquidity factor may be weak in a cross-section of portfolios sorted by, say, size and value, but may be strong in a cross-section of assets sorted by characteristics that capture exposure to liquidity. Their methodology, called “supervised PCA,” or SPCA, exploits this insight and builds a hedging portfolio for any risk factor appropriately accounting for other risk factors investors might care about, and independently on the strength of the factor.
SPCA is not the endgame in the effort to understand how to build hedging portfolios, according to the authors. However, this work shows that systematically addressing the issue of weak factors in empirical asset pricing is an important step forward and opens the door to the study of factors that, while important to investors—like our hypothetical investor from above—may be not as pervasive as they fear.
-
Gross Domestic Product, GDP, is the most widely used measure of economic activity and one that is very attractive for governments to manipulate. Although the incentive to overstate economic growth is shared by governments of all kinds, the checks and balances present in strong democracies plausibly help to prevent this behavior. In contrast, these checks and balances are largely absent from autocracies. The execution of the civil servants in charge of the 1937 population census of the USSR due to its unsatisfactory findings serves as an extreme example, but a more recent instance involves Chinese premier Li Keqiang’s alleged admission of the unreliability of the country’s official GDP estimates.

To detect and measure the manipulation of economic statistics in non-democracies, Martinez uses data on night-time lights (NTL) captured by satellites from outer space. Importantly, NTL correlate positively with real economic activity but are largely immune to manipulation. Martinez employs data for 184 countries to examine whether the elasticity of GDP with respect to NTL systematically differs between democracies and autocracies, based on the Freedom in the World index produced by Freedom House. These data are combined with a measure of average night-time luminosity at the country-year level using granular data from the Defense Meteorological Satellite Program’s Operational Line-scan System (DMSP-OLS) for the period 1992-2013, along with GDP data from the World Bank.
Martinez finds that the same amount of growth in NTL translates into higher reported GDP growth in autocracies than in democracies. His main estimates suggest that autocracies overstate yearly GDP growth by approximately 35% (for example, a true growth rate of 2% is reported as 2.7%). The autocracy gradient in the NTL elasticity of GDP is not driven by differences in a large number of country characteristics, including various measures of economic structure or level of development. Moreover, this gradient in the elasticity is larger when the incentive to exaggerate economic growth is stronger or when the constraints on such exaggeration are weaker. This strongly suggests that the overstatement of GDP growth in autocracies is the underlying mechanism.
These results constitute new evidence on the disciplining role of democratic institutions for the functioning of government. These findings also provide a warning for academics, policy-makers and other consumers of official economic statistics, as well as an incentive for the development and systematic use of alternative measures of economic activity.
-
As of 2020, more than 38 million people were displaced across borders, with most fleeing war or chronic insecurity in their origin countries, often for long durations. As a result, these forcibly displaced people, or FDP, are acutely vulnerable, facing tenuous legal status, political exclusion, poverty, poor access to services, and outright hostility, which can be exacerbated by hostilities directed toward people of differing identities.

Despite the magnitude of this challenge, few practicable policy responses exist. Fewer than 2% of all FDP have accessed any of the three “durable solutions”—resettlement in the Global North, naturalization in host countries, or repatriation to origin countries—in recent years, while efforts within the Global South are politically contentious. Since 2000, the number of resettled FDP has never exceeded 0.61% of the global displaced stock. Similarly, since 85% of FDP reside in developing countries with weak institutional capacity, naturalization in host states is complicated. Finally, though refugee return is widely regarded as the preferred solution, protracted conflicts in origin countries often render repatriation infeasible.

A number of recent policies have employed cash transfers to ease reintegration for FDPs, but there is little causal evidence for their effectiveness to date. This article advances understanding of refugee return by leveraging granular microdata on repatriation and violence, in tandem with a large cash grant scheme implemented by the United Nations High Commissioner for Refugees (UNHCR) in 2016. The cash program was aimed at Afghan returnees from Pakistan, and saw a temporary doubling of cash assistance offered to voluntary repatriates. Using a novel combination of observational and survey-based measures, the authors find the following, among other results:
- Refugee return is associated with an overall reduction, as well as a composition shift, in insurgent violence. The authors note that the cash transfer that induced repatriation may have stimulated local economic activity in areas where returnees settled.
- Social capital and preexisting kinship ties moderate the potential for refugee repatriation to spark local conflicts. Recent work has shed light on optimal settlement strategies when refugees aim to rebuild their lives in host countries, and this research clarifies how a similar intervention could be used to evaluate when, where, and with whom returning refugees should be located.
- Local institutions for conflict mediation may play a critical role for preempting conflicts before they emerge or resolve disputes after they have. The authors anticipate that local support for conflict resolution could also be tied to preexisting risk factors including customary land tenure, livestock grazing patterns, vulnerability of irrigation networks, and heterogeneous ethnic settlement patterns.
As the authors stress, and as their full paper describes, the impacts of refugee repatriation are nuanced, as are the ethical considerations relevant to programmatic interventions aimed at facilitating return. Active conflict further complicates matters. If repatriation assistance is employed to appease asylum countries eager to reduce their refugee-hosting burden, it risks inadvertently incentivizing coercive tactics and degrading the voluntariness of repatriation. Crafting sound policies requires considering the illicit, armed actors that may benefit from the return of vulnerable populations, the quality of institutions available to manage tensions around mass repatriation, and the ethical obligations of host countries.
-
Health insurance contracts account for 13% of US gross domestic product, and impose many different administrative burdens on physicians, payers, and patients. The authors measure one key administrative burden—billing insurance—and ask whether it distorts physicians’ behavior and harms patients.
Doctors and insurers often have trouble determining what care a patient’s insurance covers, and at what prices, until after the physician provides treatment. This ambiguity leads to costly billing and bargaining processes after care is provided, what the authors call the costs of incomplete payments (CIP). They estimate these costs across insurers and states and show that CIP have a major impact on Medicaid patients’ access to medical care.
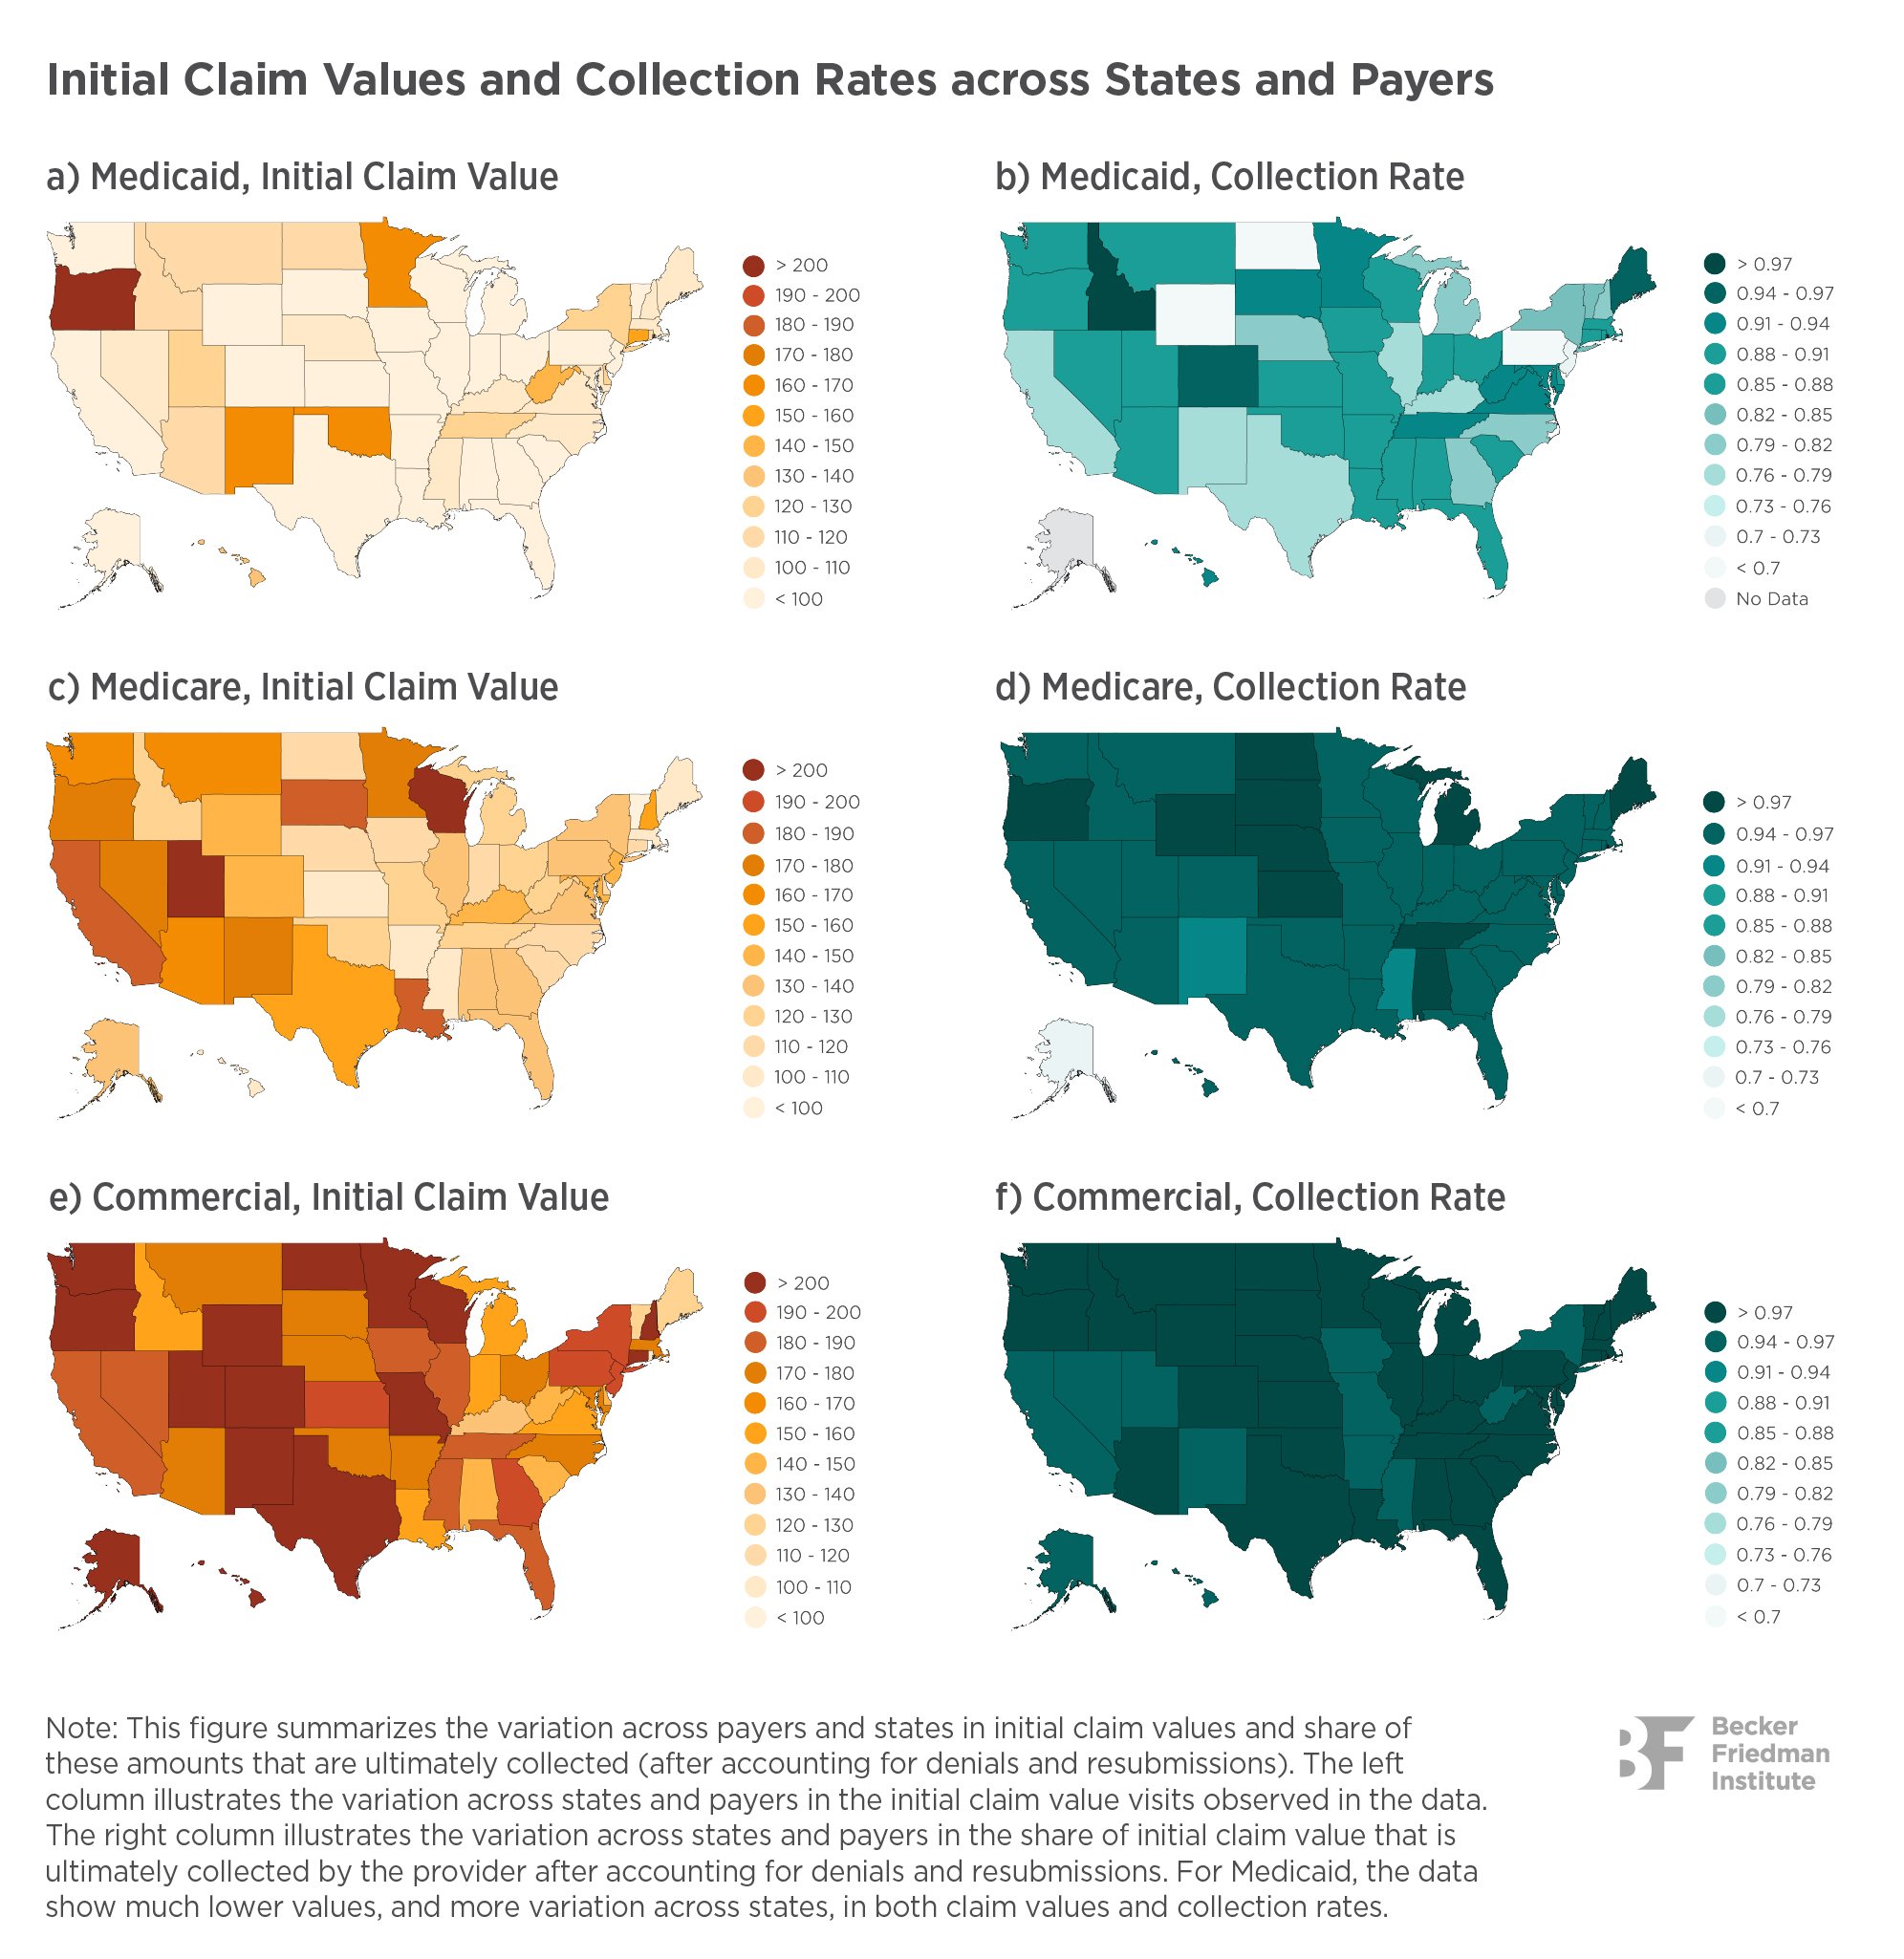
Employing a unique dataset, the authors show that payment frictions are particularly large in the context of Medicaid, a key part of the US social safety net, but which rarely provides an equal quality of care as other insurance. In particular, Medicaid patients often have trouble finding physicians willing to treat them.
The authors find that 25% of Medicaid claims have payment denied for at least one service upon doctors’ initial claim submission. Denials are less frequent for Medicare (7.3%) and commercial insurers (4.8%).How do these denials affect physician revenues? The authors’ CIP incorporates two concepts: foregone revenues, which are directly measured in the remittance data; and the estimated billing costs that providers accumulate during the back-and-forth negotiations with payers. Bottom line: The authors estimate that CIP average 17.4% of the contractual value of a typical visit in Medicaid, 5% in Medicare, and 2.8% in commercial insurance. The authors stress that these are significant losses, especially considering the relatively low reimbursement rates offered by Medicaid.

Further, the authors reveal that CIP dissuades doctors from taking Medicaid patients in the first place. A ten percentage point increase in CIP is analogous to a tax increase of ten percentage points. By examining physicians who move across states, the authors then estimate that an implicit tax increase of this magnitude reduces physicians’ probability of accepting Medicaid patients by 1 percentage point. This effect is even larger across states within a physician group. Each standard deviation increase in CIP reduces Medicaid acceptance by 2 percentage points.
This work reveals the importance of well-functioning business operations in the provision of healthcare. The key insight, that difficulty with payment collection compounds the effect of low payment rates to deter physicians from treating publicly insured patients, should give policymakers pause.
-
From 2000 to 2012, official development assistance (ODA) to conflicted states grew more than 10% per year, and totaled over $450 billion, including $120 billion to Afghanistan and $80 billion to Iraq from the United States alone. Donor nations expect foreign aid to improve stability in fragile states, in addition to furthering development, but the effectiveness of such aid is far from certain.
One prevailing challenge for aid assistance is known as donor fragmentation, wherein a multiplicity of donors shares overlapping responsibilities within a common geographical area. Donor fragmentation is widely perceived to negatively moderate the effectiveness of aid and thereby limit the quality of institutions on a number of fronts, including coordination challenges, program redundancies, selection of inferior projects due to competition among donors, lax donor scrutiny, among others.

That said, the presence of multiple foreign donors can foster exemplary norms of professional conduct when aid provisions are maintained at relatively moderate rates and competition is not pronounced. Under these and other conditions, good conduct by donors is more likely to prevail and donor proliferation may actually strengthen institutions.
Until now, these issues have been subject to little empirical scrutiny. In this work, the authors use granular data from Afghanistan to offer the first micro-level analysis of aid fragmentation and its effects. The authors results suggest that aid strengthens the quality of state institutions in the absence of fragmentation (that is, in the presence of a single donor). These benefits vanish, though, as the donor landscape becomes fragmented. Surprisingly, however, their evidence does suggest that donor fragmentation also positively affects institutions when considered at moderate levels of aid. The authors’ micro-level evidence therefore suggests the direction of fragmentation’s total effect depends on the volume of aid provision. Too much provision through too much fragmentation induces instability.
Given the paucity of theoretical and empirical research on this topic, the authors hope that this work inspires further academic research. With more nuanced theory development and broader geographical analyses, additional new insights can be generated to guide decisionmakers at various levels of aid provision.
-
Why did the Black-White wage gap drop so much during the 1960s and the 1970s, and why has the convergence stagnated since then? This new working paper builds on existing research to offer a pathbreaking task-based model that incorporates notions of both taste-based and statistical discrimination to shed light on the evolution of the racial wage gap in the United States over the last 60 years.

Their task-based model allows the authors to analyze how the changing demands for certain tasks interact with notions of discrimination and racial skill gaps in driving trends in wages across racial groups. At the heart of the model is that different occupations require a different mixture of tasks (Abstract, Routine, Manual, Contact), which in turn demand certain market skills and degrees of interaction among workers and customers. Consequently, the relative intensity of taste-based versus statistical discrimination varies across occupations depending on the exact mix of tasks required in each occupation.
The authors use their estimated framework to structurally decompose the change in racial wage gaps since 1960 into the parts due to declining taste-based discrimination, a narrowing of racial skill gaps, declining statistical discrimination, and changing market returns to occupational tasks. Their key finding is that the Black-White wage gap would have shrunk by about 7 percentage points by 2018 if the wage premium to task requirements were held at their 1980 levels, all else equal.

Why did this stagnation in the closing of the wage gap occur? The authors posit two offsetting forces:
- On the one hand, a narrowing of racial skill gaps and declining discrimination between 1980 and 2018 caused the racial wage gap to narrow by 6 percentage points during this period, all else equal.
- On the other hand, the changing returns to tasks since 1980 (particularly the increasing return to Abstract tasks) widened the racial wage gap by about 6.5 percentage points during the same period. A rise in the return to Abstract tasks disadvantages Blacks because they are underrepresented in these tasks due to racial skill gaps and discrimination. Moreover, to the extent that discrimination associated with Abstract tasks is important, the rising return to Abstract tasks will even favor Whites relative to Blacks with the same underlying levels of skills.
- Bottom line: Race-specific barriers have continued to decline in the US economy post 1980, but the rising relative return to Abstract tasks has favored Whites. As a result, the Black progress stemming from narrowing racial skill gaps and/or declining discrimination did not translate into Black-White wage convergence during this period.
The authors stress that racial gaps in skills are endogenous, meaning that taste-based discrimination could be responsible for Black-White differences in measures of cognitive test scores. Such caveats should be kept in mind when segmenting current racial wage gaps into parts due to taste-based discrimination and parts due to differences in market skills. Regardless of the reason for the racial skill gaps associated with a given task, the existence of such gaps implies that changes in task returns can have meaningful effects on the evolution of racial wage gaps, even when discrimination and the skill gaps remain constant over time.
-
The growth of sustainable investing is one of the most dramatic trends in the investment industry over the past decade, with sustainable strategies comprising one-third of current professionally managed US assets. Environmental concerns take the lead among sustainable investors; for example, 88% of the clients of BlackRock, the world’s largest asset manager, rank environment as “the priority most in focus.” Further, based on past performance, asset managers often market sustainable investment products as offering superior risk-adjusted returns; however, this work reveals that investors should be wary of such claims.

The authors employ a novel model which predicts that “green” assets have lower expected returns than “brown,” due to investors’ tastes for green assets, yet green assets can have higher realized returns while agents’ tastes shift unexpectedly in the green direction. This wedge between expected and realized returns is central to the paper. The authors explain that green tastes can shift in two ways:
- First, investors’ preference for green assets can increase, directly driving up green asset prices.
- Second, consumers’ demands for green products can strengthen, for example, due to environmental regulations, driving up green firms’ profits and, thus, their stock prices. Similarly, investors’ preference for brown assets or consumers’ demand for brown products can decrease, again making green stocks outperform.
Bottom line: green stocks typically outperform brown when climate concerns increase. Equilibrium expected returns of stocks that are better hedges against adverse climate shocks include a negative hedging premium if the representative investor is averse to such shocks. Empirically confirming a climate risk premium, however, must confront the large unanticipated positive component of green stock returns during the last decade. Without accounting for those unexpectedly high returns on stocks that appear to be relatively good climate hedges, one could be led astray. That is, one could infer that those stocks providing better climate hedging have higher expected returns, not lower, as theory predicts.
-
People experiencing homelessness are among the most deprived individuals in the United States, yet they are neglected in official poverty statistics and the extreme poverty literature and largely omitted from household surveys. Those wishing to learn about the economic circumstances of this population must turn to a handful of studies that are either localized, outdated, self-reported, or some combination of the three.

In this unprecedented project, the authors draw on underused data sources and employ novel methods to address these shortcomings to assess the permanence or transience of low material well-being among those who experience homelessness, the coverage of the safety net, and the implications of the current omission of this population from official statistics. Among other findings, the authors reveal the following:
- Nationally, only a small share of sheltered homeless adults in 2011-2018, about 9.1 percent, changed states in the year before their interview. While this is higher than one-year interstate mobility for the housed population, it is still lower than one might expect given the rhetoric on this subject. Further, longer-term measures of mobility since birth indicate only small differences between the homeless and comparison groups, suggesting that the link between mobility and homelessness is not as strong as suggested in public discourse.
- There are much higher rates of physical limitations relative to the housed population and moderately higher or similar rates of physical limitations relative to the poor comparison group.
- There is a stark disparity in the share reporting a cognitive limitation. Nearly one-quarter of the sheltered homeless ages 18-64 reports difficulty remembering or making decisions, a rate that is approximately twice that of the poor comparison group and 5.5 times that of the housed population in this age range. Cognitive limitations appear to be a significant factor distinguishing the sheltered homeless from the rest of the poor.
- Homelessness appears to be a symptom of long-term low material well-being. In other words, people experiencing homelessness appear to be having not just a year of deprivation and challenge, but a decade (at least).
- About 53 percent of the sheltered homeless had formal labor market earnings in the year they were observed as homeless, and the authors’ find that 40.4 percent of the unsheltered population had at least some formal employment in the year they were observed as homeless. This finding contrasts with stereotypes of people experiencing homelessness as too lazy to work or incapable of doing so.
- Most people experiencing homelessness are reached by some form of social safety net program, primarily SNAP and Medicaid, with at least 88 percent of the sheltered and 78 percent of the unsheltered receiving at least one benefit.
- Finally, there is a higher rate of receipt for nearly all benefits among the sheltered relative to the unsheltered homeless. Among other explanations, the authors suggest the influence of family structure, as many safety net programs are more readily available to families (who are more likely to be in shelters) than single adults.
This project is ongoing, as the authors plan to continue their examination of their novel data sources to explore several other topics related to homelessness, including transitions in and out of homelessness, migration and geographic dispersion, and mortality.
-
It follows that if physical distancing reduces interpersonal transmission risks related to the COVID-19 virus, then government policies that mandate physical distancing should slow the spread of COVID-19. Further, local non-compliance with such shelter-in-place orders would create public health risks and could cause regional spread. Given this, it is important that policymakers understand which local factors impact compliance with public health directives.

Recent research highlights several factors that influence compliance, including partisanship, political polarization, poverty and economic dislocation, and differences in risk perception, all of which influence physical distancing in the absence of government mandates. This new research highlights the role of science skepticism and attitudes regarding topics of scientific consensus in shaping patterns of physical distancing.
To examine the role of science skepticism, the authors leverage the most granular, representative data on science skepticism in the United States—beliefs about the anthropogenic (human) causes of global warming—to study how physical distancing patterns vary with skepticism toward science. The authors combine this county-level science skepticism measure with location trace data on the movement of around 40 million mobile devices as well as data on state-level shelter-in-place policies, to find the following:
- Science skepticism is likely an important determinant of local compliance with government shelter-in-place policies, even after accounting for the role of partisanship, population density, education, and income, among other factors.
- Shelter-in-place policies increase the proportion of devices that stay at home by 2 p.p. (p-value < 0.001) more in counties with low levels of science skepticism compared to counties with high levels of skepticism. This corresponds to an 8% increase in devices that stayed at home, compared to the February average of 25%.
The authors also benchmark their measure of science skepticism against other measures of belief in science available at the state-level to show that their measure captures a more general notion of skepticism toward topics of scientific consensus.
-
In the United States, the Social Security Disability Insurance and Supplemental Security Income programs together provide access to health insurance and $200 billion annually in cash benefits to nearly 13 million Americans, primarily as assistance for people who cannot work because of severe health conditions. Some have attributed the expansion of US disability programs at least in part to non-health factors like stagnating wages, along with widespread concern that providing benefits to individuals without severe health conditions dilutes the programs’ value.

This issue raises an important question: What is the overall insurance value of US disability programs, including value from insuring non-health risk? To address this question, the authors quantify the extent to which these programs insure different risks by comparing disability recipients and non-recipients along a wide variety of health and non-health dimensions, including consumption, adverse events like job loss, and resources available to cope with adverse events, as well as other comparisons.
The authors’ approach allows them to go “beyond health” when determining the value of such programs. While health is likely a strong indicator of the value of receiving disability benefits, it is not a perfect indicator because individuals face major non-health risks as well, including job loss, productivity shocks, and changes in family structure. To the extent that a particular risk is not completely insured by other means, disability insurance potentially insures or exacerbates that risk, depending on whether people receive disability benefits.
The authors perform a series of measurements and find that less-severe disability recipients are on average much worse off than less-severe non-recipients, and by many non-health measures are even worse off than more-severe recipients. For example, they find that prior to receiving disability benefits, less-severe recipients are 40% more likely to have experienced a mass layoff than more-severe recipients, 19% more likely to have experienced a foreclosure, and 23% more likely to have experienced an eviction.
Further, the authors show that the value of disability benefits exceeds that of cost-equivalent tax cuts by 64%, creating a surplus worth $8,700 of government revenue per recipient per year. Moreover, they find that the high value of US disability programs is in part because of, not despite, mismatches with respect to health. They estimate that benefits to less-severe recipients create a value (insurance benefit less distortion cost) over cost-equivalent tax cuts of $7,700 per recipient per year, about three-fourths that of benefits to more-severe recipients ($9,900).
Bottom line: Benefits to less-severe recipients do not decrease the value of US disability programs; rather, they increase it considerably, accounting for about half of the total value.
The authors draw an important conclusion from their work—no program exists in a vacuum, Instead, a program’s effects reflect the diversity of risks in the economy, how well insured those risks are by other programs and institutions, and how its tags and screens select on those risks.
In this case, US disability programs insure risks well beyond health, and this “incidental” role is central to their overall value. Other programs might also provide similar returns.
-
Since the 1970s, stagnating average earnings and rising earnings inequality in US labor markets have spurred academic research and fired policy debates. This issue has only intensified in recent decades as attention has focused on the plight of male workers in industries and regions facing economic decline. Despite this interest, existing research has provided little insight into trends in lifetime earnings, offering only point-in-time analysis of annual incomes.

In a first-of-its-kind study, this paper addresses this gap by constructing measures of lifetime earnings for millions of individuals using a 57-year-long panel (1957–2013) from US Social Security Administration (SSA) records. The authors’ lifetime earnings measure is based on 31 potential working years between ages 25 and 55, which allows them to construct lifetime earnings statistics for 27 year-of-birth cohorts. The oldest cohort turned age 25 in 1957, and the youngest one turned age 55 in 2013, the last year of their sample.
The authors examine how lifetime earnings of the median male worker changed from the first cohort (1957) to the last (1983). [They also examine changes in women’s roles in the labor market over this period. See related Research Brief.] Their analysis reveals the following key fact: The lifetime earnings of the median male worker declined by 10% from the 1967 cohort to the 1983 cohort. Perhaps more strikingly, more than three-quarters of the distribution of men experienced no rise in their lifetime earnings across these cohorts. Accounting for rising employer-provided health and pension benefits partly mitigates these findings but does not alter the substantive conclusions.

How are these changes reflected in wage/salary earnings? When nominal earnings are deflated by the personal consumption expenditure (PCE) deflator, the annualized value of median lifetime wage/salary earnings for male workers declined by $4,400 per year from the 1967 cohort to the 1983 cohort, or $136,400 over the 31-year working period. (When the authors adjusted for inflation using the consumer price index, the decline in median male lifetime earnings is nearly twice as large.)
For policymakers, these findings are sobering, and important. For example, the authors show that newer cohorts of workers were already different from older ones by age 25. Once in the labor market, the earnings distribution for these newer cohorts evolved similarly to those of older cohorts. Further, the authors’ findings suggest that the sources of the dramatic changes in the US earnings distribution over the last 50 years may be found in the experiences of newer cohorts during their youth (and possibly earlier). To illustrate, please see Figure 2, which reveals that the decline in median earnings at age 25 continued until 1993, after which time there was a brief resurgence followed by another period of decline. In 2009, median earnings for 25-year-old males were at their lowest point since 1958.
-
While research has offered insights into the economic costs of civil conflict, the effect on investment decisions is little understood. Do producers forgo profitable investment opportunities when faced with the uncertainties surrounding civil conflict? If so, such missed investment could restrict economic growth and further exacerbate cycles of violence.

The authors address this research gap by examining the effect of civil conflict on investment by Colombian farmers using granular credit data from the country’s largest agricultural bank, Banco Agrario de Colombia (BAC). BAC is the only source of formal credit in many rural areas, and the authors’ dataset includes the universe of the bank’s business loans to small producers between 2009 and 2019 (2.9 million), corresponding to 1.7 million different applicants, which is equivalent to 64% of the country’s agricultural producers. These data also have unique features pertaining to timing, applicant status, and loan outcomes.
The authors examine variation in conflict arising from the 2016 demobilization agreement signed by the Colombian government and FARC, the Marxist guerrilla group fighting against the government in a civil conflict that ravaged the Colombian countryside for over 50 years, with an estimated death toll exceeding 200,000 victims. The authors calculate total FARC activity per municipality between 1996 and 2008, the most violent years in the conflict, and then rank those municipalities according to conflict exposure. This allows them to compare credit outcomes based on FARC exposure.
Their findings include the following:
- The end of the conflict leads to a sizable increase in credit to small farmers in municipalities with high FARC exposure, about 19 million Colombian pesos ($14,500) in total monthly credit disbursements per 10,000 inhabitants, equivalent to a 17% increase over the sample average. This increase is driven by higher loan applications, without any meaningful change in supply-side factors, including approval rates and interest rates.
- The increase in the demand for credit in FARC municipalities is disproportionately driven by new clients with lower wealth and longer-term investments (i.e., higher loan maturity). Importantly, there is no change in the average credit score of loan applicants, nor in delinquency rates for new or outstanding loans over various time horizons.
- There are significant heterogeneous effects across time and space, that is, the authors find no evidence of an increase in credit demand during the interim negotiations period, despite a substantial de-escalation of the conflict. This suggests that armed group presence and uncertainty about renewed violence affect investment more than contemporaneous intensity. Moreover, the increase in credit demand is concentrated in municipalities close to markets.
Taken together, these findings provide key insight into the effect of civil conflict on investment decisions. While this research does not capture the macroeconomic impact of the peace agreement, it does provide evidence suggestive of a broadly positive economic impact. First, the fact that farmers are demanding more credit and paying back their loans suggests that these are profitable investments. Also, in-person audits of project sites indicate that farmers are generally using the funding for the declared purpose. Finally, the documented increase in nighttime luminosity in FARC municipalities following the peace agreement is consistent with a broad expansion of local economic activity, which arguably contributes to higher returns to investment and greater demand for credit.
-
At least theoretically, citizens can combat corruption among elected officials by voting out the perpetrators and electing other candidates. Despite this option, corruption persists. Research has suggested that citizens lack the information necessary to vote out bad actors. Still other research shows that even with adequate information, voters do not respond as expected. What explains this phenomenon?

This research sheds new light on this question by analyzing responses to the 2010 Kabul Bank crisis, one of the largest banking failures in the world, which revealed corrupt links between high-ranking Afghanistan public officials and the largest Afghan private lender. Within days, the scandal triggered widespread bank runs and the largest government bailout in the country’s history. The scandal unfolded three weeks before the 2010 parliamentary election and, in a bit of providential coincidence, the scandal also occurred midway through the collection of a nationwide survey, which included questions about corruption in government, voter preferences, and the efficacy of government institutions.
The timing of the survey, along with a fixed sampling that was randomized within districts, allowed the authors to adopt a novel quasi-experimental approach when analyzing the results. The authors reveal the following key findings:
- Overall, while individuals interviewed after the scandal broke were no more or less likely to think that corruption in government was a serious problem, the informational shock did cause a statistically and substantively significant decrease in citizens’ intention to vote in the parliamentary election scheduled two weeks later.
- However, the authors also find that in areas with low political efficacy, that is, where citizens are skeptical of their ability to influence political reform, news of the scandal did not affect these individuals’ assessment of corruption being a serious problem in government, but the news did make them less likely to intend to vote in the parliamentary election several weeks later.
- In contrast, in areas with relatively high levels of self-reported political efficacy, the authors find a mobilizing effect from information about corruption on voter turnout: In this case, the unfolding bank scandal had a sizeable, positive, and highly statistically significant effect on respondents’ intention to vote.
While the authors are careful not to lend a causal interpretation to their observed heterogeneous effects, their findings do suggest that political efficacy likely plays an important role in shaping how voters mobilize in the wake of an unexpected corruption scandal. Regardless of what explains variation in the ebb and flow of political efficacy across and within countries, this work suggests that citizens will react differently to information about corruption because of political efficacy.
-
In the decade following the financial crisis of 2008, investment funds in corporate bond markets became prominent market players and generated concerns of financial fragility. Figure 1 demonstrates the dramatic growth of their assets under management relative to the size of the corporate bond market since the 2008-2009 crisis. Increased bank regulation has pushed some of the activities from banks to non-bank intermediaries, heightening fears among regulators. Just in 2019, Mark Carney, the governor of the Bank of England, warned that investment funds that include illiquid assets but allow investors to take out their money whenever they like were “built on a lie” and could pose a big risk to the financial sector. However, despite these concerns, the last decade did not feature major stress events to test the resilience of corporate-bond investment funds. Hence, there is a dearth of systematic evidence on their resilience in large-stress events.

The authors address this gap by analyzing recent events around the COVID-19 crisis, which provide an opportunity to inspect the resilience of these important non-bank financial intermediaries in a major stress event and the unprecedented policy actions that followed it. The COVID-19 crisis unfolded quickly around the world in early 2020. Initial declaration of a public health emergency was made January 31, with reports of confirmed infections intensifying in March. On March 13, a national emergency at the federal level in the United States was declared. Financial markets tumbled as these events took place, with corporate bond markets in particular experiencing severe stress amid major liquidity problems.
The Federal Reserve responded aggressively with a March 23 announcement of the Primary Market Corporate Credit Facility (PMCCF) and Secondary Market Corporate Credit Facility (SMCCF), which were designed to purchase $300 billion of investment-grade corporate bonds. On April 9, the Fed announced the expansion of these programs to a total of $850 billion and an extension of coverage to some high-yield bonds. These facilities were unprecedented in the history of the Fed. As such, their announcements had a major impact on corporate-bond markets. Spreads for both investment-grade and high-yield rated corporate bonds, which almost tripled relative to their pre-pandemic level by March 23, reversed after the two policy announcements.

This recent episode allowed the authors to empirically investigate two important and related questions: How fragile were these corporate bond funds and how effective were the Fed’s actions in contributing to a resolution? Using daily data on flows into and out of mutual funds in corporate bond markets during the crisis allowed the authors to shed light on the determinants of flows across different funds, and thus to better understand the sources of fragility and what actions mitigated that instability. In summary, they highlight three main sources of fragility: asset illiquidity, vulnerability to fire-sales, and sector exposure.
The authors then show that the Fed bond purchase program helped to mitigate fragility by providing a liquidity backstop for their bond holdings. In turn, the Fed bond purchase program had spillover effects, stimulating primary market bond issuance by firms whose outstanding bonds were held by the impacted funds, and stabilizing peer funds whose bond holdings overlapped with those of the impacted funds. This analysis uncovers a novel transmission channel of unconventional monetary policy via non-bank financial institutions, which carries important policy lessons for how the Fed bond purchases transmit to the real economy.
The authors caution that massive Fed intervention in the market will likely not become the norm and, likewise, some of the structural fragilities in the way investment funds operate in illiquid markets must be addressed more directly.
-
The Covid-19 pandemic forced a dramatic rush to work from home (WFH) in early 2020. Even if only a fraction of this global shift became permanent, it would have implications for urban design, infrastructure development, and reallocation of investment from inner cities to residential areas. Of course, it would also have significant implications for how businesses organize and manage their workforces.
There is significant debate about the effectiveness of WFH, including how much further we can improve implementation, and the extent to which firms will continue the practice. Initial experiences led to optimism, but many firms are starting to question the sustainability of extensive WFH. One of the most important questions in this context is how WFH affects productivity.

This paper provides an analysis of the effects of the switch to WFH in a large Asian IT services company that abruptly switched all employees to WFH in March 2020. This study has several novel features, including a rich dataset for a sample of more than 10,000 employees for 17 months before and during WFH. The data include information on productivity, hours worked and how that time was allocated, and the employee’s contacts with colleagues inside and outside the firm. In addition, it includes an estimate of the employee’s commute time when they had worked at the office, and how many children (if any) they have at home.
The key measures are based on relatively objective measures of work time and the employee’s output, which were collected from the firm’s workforce analytics systems. The company has a highly developed process for setting goals and tracking progress, culminating in a primary output measure for each employee. The data also include information on hours worked, the authors’ primary input measure. Productivity is measured as output divided by hours worked. Most prior studies of WFH were based on survey data, so this is an unusual opportunity to study employee performance using the measures that the firm employs.
These data also include (for a subset of employees) time allocation for various activities, including meetings, collaboration, and time focused on performing work without distractions. It also includes information on networking activities (contacts) with colleagues inside and outside the firm, as well as various employee characteristics.
Of note, most employees at this company are highly skilled professionals in an IT company where nearly all are college educated. The jobs involve significant cognitive work, developing new software or hardware applications or solutions, collaborating with teams of professionals, working with clients, and engaging in innovation and continuous improvement. These job characteristics may present significant challenges to effective WFH. By contrast, previous studies of WFH productivity either used self-reported measures of productivity or focused on occupations where workers have relatively simple and repetitive tasks, often follow scripts, and work independently, such as call center workers.
Finally, the data allowed them to compare outcomes for the same employee before and during WFH. The authors find the following:
- Employees significantly increased total hours worked, by about 30%, during WFH. Much of this increase came from working outside of normal office hours.
- Despite the disruption due to the pandemic and shift to WFH, there was no significant change in measured output (the primary evaluation metric for each employee). In other words, employees continued to meet their goals, which were not changed after the switch to WFH.
- Given their results on work time and output, the authors estimate that productivity declined considerably, about 20%. These results are consistent with employees becoming less productive during WFH and working longer hours to compensate.
Why did productivity decline? The authors find that employees spent more time engaged in various types of formal and informal meetings during WFH, especially video conferences. Likewise, they spent substantially less time working without interruption. They also spent less time networking (both within the firm and with clients), and less time receiving coaching or 1:1 meetings with supervisors. These findings suggest that increased coordination costs during WFH at least partially explain the drop in productivity.
The authors also found that the productivity of women was more negatively affected by WFH than men. However, this gender difference was not due to the presence of children in the home. Rather, the likely culprit is other demands placed on women in the domestic setting. Employees with children at home increased working hours significantly more than those who did not have children at home, accounting for a greater decrease in productivity.
Among other considerations, these and other findings suggest that communication, coordination, and collaboration are hampered under WFH, and employers should not underestimate the value of networking and uninterrupted work time on employee productivity.
-
Understanding how wartime casualties influence public support for withdrawal and which mechanisms underlie this relationship remains an important challenge, especially in the context of conflicts fought through military coalitions. In these coalitions, the political costs of losses can induce free-riding, where some coalition partners limit the combat operations of their troops—under-providing security in areas of operation—to avoid political backlash at home.

The authors study these and other dynamics in a highly relevant context—the ongoing military campaign in Afghanistan—where North Atlantic Treaty Organization (NATO) affiliated forces have conducted operations since 2001. The authors employ granular, nationally representative individual-level public opinion survey data collected across eight major troop-sending NATO countries from 2007-2011, including the United States, United Kingdom, and other key troop-contributing coalition partners. These surveys cover a critical phase of NATO operations in Afghanistan, including the troop surge.
The authors identify combat events involving casualties of a troop-sending nation around the interview date specific to each respondent and specific to the nationality of the respondent. Using a series of quasi-experimental designs, the authors provide novel and compelling causal evidence linking battlefield losses to public demand for withdrawal in troop-sending countries and demonstrate the role of media coverage in shaping civilian attitudes toward the war. Specifically, they show that country-specific casualty events are associated with a significant worsening of public support for continued engagement in the conflict.
To assess this finding, the authors take advantage of the otherwise exogenous timing of prominent events that crowd out coverage of troop fatalities. In other words, if other news events—in this case, major sporting matches—exert news pressure such that war coverage is likewise diminished, would this alter public opinion about the war in meaningful ways? The answer is yes. The authors find compelling evidence that the elasticity of conflict coverage on own-country casualties diminishes significantly when sporting events introduce news pressure. They also find that public support for the war is unaffected by own-country casualties when news coverage has been crowded out by sporting matches.
Bottom line: the authors provide credibly causal evidence that public demands for withdrawal increase with war-related casualties and demonstrate that media coverage is likely a central driver of changes in sentiment. These results are important and relevant in understanding the economics of conflict and the policy implications of battlefield dynamics. When democratic countries participate in a foreign military intervention, public support for the war is a key constraint, to which multilateral military interventions may be particularly sensitive.
-
Governments around the world have deployed numerous policy instruments to control the spread of COVID-19, with some instruments, such as large-scale lockdowns, causing significant economic harm. These costs have been especially pronounced in developing countries, where economic slowdowns associated with COVID-19 policies combined with weak social safety nets were expected to push between 71–100 million people into extreme poverty in 2020.

Domestic travel bans are a particularly severe and relatively common restriction. Motivated in part by simulation exercises that model them as effective methods for reducing the spread of disease, they also impose substantial and inequitable economic costs, which make them difficult to sustain indefinitely. As a result, these policy instruments necessarily involve two decisions: (i) whether to restrict freedom of movement and (ii) for how long to do so.
To examine these decisions, the authors focus on domestic travel bans implemented by developing countries, which are frequently characterized by the presence of large populations of migrant workers. A United Nations report that examines data from 70 countries and more than 70% of the global population found that more than 763 million people were living within their home country but outside their region of birth in 2005. In addition, the rural-to-urban migration most affected by COVID-19 mobility restrictions is more common in developing countries than in the developed world, and the presence of a large population that may respond to economic shocks by moving has motivated many developing countries to utilize travel bans to prevent the spread of disease.
For this work, the authors estimate the impact of travel ban duration on the spread of COVID-19 by simulating disease transmission using a standard model that mimics a real-world scenario facing many developing countries, in which migrants leaving an urban hotspot spread infections to a rural destination. The results from this modeling exercise generates their key hypothesis: that the impact of travel bans is nonlinear in duration.
To test this finding empirically, they examine a natural experiment in Mumbai, India—the country’s financial capital and initial COVID-19 epicenter—which relaxed travel bans after varying durations. On March 25th, the country imposed a nationwide lockdown, maintaining a ban on domestic travel out of the city, causing immense suffering as the economy rapidly contracted and unemployment rose, especially among migrant workers, who do not have access to the social safety net in India. Under intense pressure, the government allowed the first wave of migrants to return to homes outside Mumbai’s state of Maharashtra on May 8. Phase 2 migrants, returning to districts in the Mumbai Metropolitan Area, were allowed to leave on June 5, and Phase 3 migrants, departing to all other destinations, were able to leave on August 20. Finally, the authors used cross-country data to examine travel bans in Indonesia, India, South Africa, the Philippines, China, and Kenya. Together, these countries comprise roughly 40% of the global population.
The authors’ model and empirical results are in agreement about domestic travel bans: relatively short and relatively long restrictions can successfully limit the spread of COVID-19; however, intermediate length bans—once lifted—can significantly increase COVID-19 growth rates, cumulative infections, and deaths. The full effect of travel bans can therefore only be quantified after they are lifted. More broadly, these results underscore that quantifying the unintended consequences of COVID-19 restrictions, including both disease and economic costs, is critical for policy decisions.
-
Why do individuals join armed groups? Research has pointed to several causes, including profit motives for gang members, economic incentives for those involved in civil conflicts, and nonmaterial motives such as intrinsic motivations that can be fueled, for example, by the desire for revenge, say, when a family member is killed by another group.

Economists have recognized the importance of nonmaterial motives for civil conflict. However, there is no empirical evidence in economics about the importance of intrinsic motivation for armed group recruitment, except through self-reported narratives. This paper attempts to settle this debate and demonstrate how nonmaterial motives form by providing evidence for the formation, and effects, of intrinsic preferences to join armed groups, in eastern Democratic Republic of the Congo (DRC), where about 120 nonstate armed groups operate in eastern DRC, some of which are considered foreigners, and where numerous local militias have formed to oppose these many groups.
The authors assembled a yearly panel dataset on the occupational choices and household histories of 1,537 households from 239 municipalities, and the violence perpetrated by armed actors on those households, dating back to 1990. They measured exposure to attacks on households and participation into armed groups using household histories. In other words, because of the specific context of the study, and approaches to minimize concerns of misreporting, participation histories could be reconstructed. The authors’ main analysis exploits variation in exposure to foreign armed group attacks across and within households over time.
Employing a many-layered methodology to, among other factors, isolate the causal effect of an attack by foreign armed groups, the authors find that if a household has been attacked by a foreign armed group, the probability that the individual in such a household participates in a Congolese militia is 2.55 pp (2.36 times) larger in each subsequent year. This effect is so large that it drives the effect of attacks by any armed group on participation into any armed group.
To assess the conditions of external validity of this result, the authors examine heterogeneous effects during years in which state forces are present, or absent, from the villages in which individuals participate in armed groups. They find that the baseline estimate is entirely driven by years in which state forces are absent. Using plausibly exogenous variation in the presence of state forces, they conclude that exposure to attacks by household members leads to the forging of preferences for joining militias, but that those preferences are only expressed in actually joining in years in which the state forces are absent to repress them.
The authors find that the main effect is consistent with the formation of preferences arising from parochial altruism towards family members, and rule out leading alternative causal channels that could explain their baseline estimate. The effect of victimization on participation is so large that it would take a prohibitive increase in income outside armed groups to undo it—a permanent 18.2-fold increase in yearly per capita income.
In sum, this paper provides evidence for the forging of rebels by illustrating that violent popular movements form from the interaction of intrinsic motivation to take arms, as well as state weakness. The effect of victimization on participation is so large that it would take a prohibitive increase in income to undo it. The results suggest that violations perpetrated by foreign armed groups generate among the relatives of the victims a desire—and possibly a moral conviction—to fight back. This work also provides the first-of-its-kind evidence for the forging of rebels through the forging of preferences and shows that nonmaterial motives can explain a high-stake conflict and a high-stake developmental outcome.
-
Assortative mating, or who marries whom, fundamentally shapes our society, as it determines the joint attributes of married couples. Recent descriptive studies raise the question of why college graduates are so likely to marry someone within their own institution or field of study. Explanations include pure selection, whereby individuals may match on traits correlated with choice of college field or institution, or causation, where the choice of college education causally impacts whether and whom one marries, and which can operate through a number of channels, including search frictions or preferences for spousal education.

Sorting out these explanations is central both to gauge the socio-economic consequences of college education and to understand how education policy and college admission criteria may influence outcomes in the marriage market. Furthermore, evidence that individuals match with the same education types primarily because of search frictions as opposed to preferences would suggest that marriage markets are much more local than typically modeled or described by economists. This research analyzes these explanations and, by doing so, examines the role of colleges as marriage markets.
The context of the authors’ study is Norway’s postsecondary education system. The centralized admission process and the rich nationwide data allow them to observe not only people’s choice of college education (institution and field) and workplace, but also if and who they marry (or cohabit with), and to credibly study effects of college enrollment. The authors find the following:
- The type of postsecondary education is empirically important in explaining whom but not whether one marries.
- Enrolling in a particular institution makes it much more likely to marry someone from that institution. These effects are especially large if individuals overlapped in college, are sizable even for those who studied a different field and are not driven by geography.
- Enrolling in a particular field increases the chances of marrying someone within the field but only insofar as the individuals attended the same institution. Enrolling in a field makes it no more likely to marry someone from other institutions with the same field.
- The effects of enrollment on educational homogamy (or marriage between people from similar backgrounds) and assortativity vary systematically across fields and institutions, and tend to larger in more selective and higher paying fields and institutions.
- Only a small part of the effect of enrollment on educational homogamy can be attributed to matches within the same workplace.
- Lastly, the effects on the probability of marrying someone within their institution and field vary systematically with cohort-to-cohort variation in sex ratios within institutions and fields. This finding is at odds with the assumption in canonical matching models of large and frictionless marriage markets.
Taken together, these findings suggests that colleges are effectively local marriage markets, mattering greatly for the whom one marries, not because of the pre-determined traits of the students that are admitted but as a direct result of attending a particular institution at a given time.
-
COVID-19 triggered a mass social experiment in working from home (WFH). Americans, for example, supplied roughly half of paid work hours from home between April and December 2020, as compared to 5 percent before the pandemic. Will this phenomenon continue after the pandemic ends?

To answer this question and to gauge other post-pandemic effects, the authors employed multiple waves of data from an original cross-sectional survey design that they have fielded about once a month since May 2020, and which includes 27,500 responses from working-age Americans. Their findings include the following:
- Employers plan for workers to supply 20.5 percent of full workdays from home after the pandemic ends. Roughly speaking, WFH is feasible for half of employees, and the typical plan for that half involves two workdays per week at home. Business leaders often mention concerns around workplace culture, motivation, and innovation as important reasons to bring workers onsite three or more days per week, while acknowledging net WFH benefits for one or two days per week.
- Most workers welcome the option to work remotely one or more days per week, according to our data, with respondents willing to accept pay cuts of 8 percent, on average, for the option to work from home two or three days per week after the pandemic. WFH desires are pervasive across groups defined by age, education, gender, earnings, and family circumstances. The actual incidence of WFH rises steeply with education and earnings.
- The extent of WFH in the post-pandemic economy is four times its pre-pandemic level, but only two-fifths of its average level during the pandemic. This implies a partial reversal of the massive COVID-induced surge in WFH. The reversal mostly involves adjustments on the intensive margin, whereby many persons WFH five days per week during the pandemic will shift to two or three days per week after it ends.
These shifts in work patterns will have important consequences. For example, high-income workers, especially, will enjoy large benefits from greater remote work. Also, spending in major city centers will fall by 5-10 percent or more relative to pre-pandemic levels. Finally, the authors’ data on employer plans and the relative productivity of WFH imply a 6 percent productivity boost in the post-pandemic economy due to re-optimized working arrangements. Less than one-fifth of this productivity gain will show up in conventional productivity measures, because they do not capture gains from less commuting.
-
Public works programs are often used to address the social challenges of unemployment, underemployment, and poverty by offering temporary employment for the creation of public goods, such as roads or infrastructure. Such workfare programs have theoretical advantages over cash-transfer programs, including provision to more disadvantaged recipients who would self-identify because of their willingness to work, as well as potential long-run benefits that accrue via work experience.

To assess the practical effects of these theoretical promises, the authors study labor-intensive public works programs in Sub-Saharan Africa that were adopted in response to such shocks as economic downturns, climatic shocks, or episodes of violent conflicts, and that offer public employment as a stabilization instrument. In doing so, the authors make two important contributions: They analyze both the contemporaneous and post-program impacts of a randomized public work program on participants’ employment, earnings and behaviors; and they leverage machine learning techniques to study the heterogeneity of program impacts, which is key to assessing whether departing from self-targeting would improve program effectiveness.
This second contribution is key because it suggests that improvements in self-targeting or targeting are first-order program design questions. Given the estimated distribution of individual program impacts, the authors show that a lower offered wage (and the subsequent change in self-targeting) was unlikely to improve program performance. In contrast, a range of practical targeting mechanisms perform as well as the machine learning benchmark, leading to stronger impacts during the program without reductions in post-program impacts.
The authors examine a program implemented by the Côte d’Ivoire government in the aftermath of a post-electoral crisis in 2010/2011. Funded by an emergency loan from the World Bank, the stated objective was to improve access to temporary employment opportunities among low-skilled, young (18-30) men and women in urban or semi-urban areas who were unemployed or underemployed, as well as to develop their skills through work experience and complementary training. Participants were remunerated at the statutory minimum daily wage.
All young men and women in the required age range and residing in one of 16 urban localities in Côte d’Ivoire were eligible to apply to the program. Because the number of applicants outstripped supply in each locality, fair access was based on a public lottery, allowing for a robust causal evaluation of the impacts of the program. In addition, randomized subsets of participants were also offered such benefits as entrepreneur and job-search training. Surveys of the treatment and control groups occurred at baseline, during the program (4 to 5 months after the program had started), and 12 to 15 months after the program ended.
The authors’ findings include the following:
- Impacts on employment are limited to shifts in the composition of employment towards the public works wage jobs during the program, with no lasting post-program impacts on the likelihood or composition of employment.
- Public works increase earnings during the program, but post-program impacts on earnings are limited.
- Savings and psychological well-being improve both during and (to a lesser extent) post-program. However, the authors find no long-lasting effects on work habits and behaviors, despite improvements during the program.
Finally, impacts on earnings remain substantially below program costs even under improved targeting. All things considered, should public work programs be deprioritized in favor of welfare programs with more efficient targeting procedures and lower implementation costs? Not necessarily. The authors stress that their analysis does not take into account all possible benefits of the program, both for the beneficiaries themselves but also for non-beneficiaries. For example, they observe lasting effects on psychological well-being and savings among beneficiaries that are not included in the cost-benefit ratios; they acknowledge the likelihood of other positive externalities associated with the program, such as a reduction in crime or illegal activities due to an incapacitation effect; and the authors do not quantify the societal value of the upgraded infrastructure.
-
What drives big moves in national stock markets? The benchmark view in economics and finance holds that stock price changes reflect rational responses to news about discount rates and corporate earnings, which suggests that big daily moves are accompanied by readily identifiable developments that affect discount rates and anticipated profitability. Another view, first introduced by Keynes in1936, suggests that investors price stocks based not on their opinions about fundamental values but on their opinions about what others think about stock values.

In either case, though, these forces are described in contemporaneous news accounts, according to the authors, and they employ such accounts to distill information about what triggers big moves in national stock markets. The authors examine next-day newspaper accounts of large daily jumps in 16 national stock markets to assess their proximate cause, clarity as to cause, and the geographic source of the market-moving news. Their sample of 6,200 market jumps yields several findings:
- Policy news, mainly that associated with monetary policy and government spending, triggers a greater share of upward than downward jumps in all countries.
- The policy share of upward jumps is inversely related to stock market performance in the preceding three months. This pattern strengthens in the postwar period.
- Market volatility is much lower after jumps triggered by monetary policy news than after other jumps, unconditionally and conditional on past volatility and other controls.
- Greater clarity as to jump reason also foreshadows lower volatility. Clarity in this sense has trended upwards over the past century.
- Finally, and excluding US jumps, leading newspapers attribute one-third of jumps in their own national stock markets to developments that originate in or relate to the United States. The US role in this regard dwarfs that of Europe and China.

Regarding their final finding, the authors note that from 1980 to 2020, 32 percent of all jumps in non-US stock markets were triggered by news emanating from or about the United States. This assessment reflects the reportage in leading own-country newspapers about their national stock markets. Also, jumps in other countries attributed to China-related developments were rare before the mid 1990s but have become much more frequent in recent years.
-
Armed actors that move into a new territory have two broad choices: pillage and plunder to extract wealth, or enforce property rights and markets and, thus, extract wealth via various forms of taxation and fees. This paper examines why armed actors restrain their power to arbitrarily expropriate wealth.
To address this question, the authors analyzed the incentives to restrain from violence and arbitrary theft by an armed group in eastern Democratic Republic of the Congo (DRC), the Front de Liberation du Rwanda (FDLR). The FDLR is a foreign armed group created from former Rwandan armed forces and militia members that perpetrated the 1994 Rwandan genocide. Known as one of the most brutal among the 122 armed groups in eastern DRC today, the FDLR often engaged in violence, sexual violence, torture, and pillages. Yet, despite their tendency to use violence arbitrarily, by 2009 the FDLR had created state functions, collected taxes, and protected the villages they taxed in the eastern DRC. They created markets that they taxed, blocked villages to impose transit fees, and raised poll and mining taxes. Arbitrary violence was kept low.

In March 2009, a military operation consisting of 30,000 Congolese and UN soldiers, dismantled the FDLR and drove them from the villages, but were unable to permanently defeat them. FDLR forces regrouped in a nearby forest where the Congolese security was limited. Suddenly unable to tax the villages that they formerly controlled, the FDLR launched sporadic violent attacks to expropriate wealth from villagers.
Why did the FDLR originally use its power to perform state functions instead of arbitrary Expropriation? In addition to possibly caring for those under submission, the authors posit that the FDLR had secured a property right over revenues from theft over a long horizon, leading them to tax instead of arbitrarily expropriate villages, which could potentially destroy growth. They took a long-run view, in other words, and determined that there was more to gain from protection and extraction.
Indeed, employing an event study and differences-in-differences framework, this is precisely what the authors find: the ability to permanently steal disciplines the use of violence by armed actors and incentivizes state functions. The authors’ finding is contained in the words of an armed actor informant: “The bandit is only your friend if he gets something out of it.”
This work offers new insights into the economic logic of violence: the disciplining effect of the time horizon of stealing, and provides an explanation for the creation, or collapse, of state functions. This mechanism also offers a new description for how classic policies against crime can backfire. While some existing research shows that crackdowns can drive criminal activity to other locations, this work reveals how crackdowns can lead crime to switch to a socially costlier activity, in the same location, and reveals that armed actors’ stealing horizon protects civilians.
-
One of the notable trends in the US manufacturing sector in recent decades has been a pronounced increase in concentration and markups, with one key exception—the consumer-packaged goods (CPG) industry. Dominant national brands of the past half century have actually experienced falling sales and decreasing market shares at the hands of smaller CPG firms.

In 2018, 16,000 smaller CPG manufacturers accounted for 19% of all US CPG sales, an increase of 2 percentage points ($2 billion) over the previous year. That same year, the 16 largest CPG manufacturers accounted for 31% of CPG sales, down from 33% five years earlier. This rapid growth of smaller brands represents a striking, structural break in the historically high and persistent concentration of CPG categories and the dominance by large, national brands.
What accounts for this shift? Industry experts routinely point to a demand-side explanation, identifying the generation of Millennials—consumers born after 1980—as the leading cause of this decline in the sales of established brands, often citing surveys that reveal a preference for smaller brands among younger consumers. However, this theory lacks a mechanism for understanding why Millennials might form intrinsically different tastes from older generations.
This new research proposes an alternative idea. While placing their hypothesis within the context of existing consumption capital theory and maintaining the neoclassical assumption of stable tastes, the authors posit that generational differences in behavior reflect heterogeneity in the accumulation of consumption and brand capital. Older generations of consumers had already accumulated decades of consumption capital with established, national brands by the time that new craft and artisanal CPG products started to enter. In contrast, the younger Millennial generation of consumers often had access to both craft and established national brands as they started to form their shopping habits.
The authors look to the US beer industry to conduct an empirical test. They study the take-home segment in the US beer industry, one of the leading examples of an industry disrupted by the sudden emergence of craft brands, which grew from $10 billion to $29.3 billion between 2010 and 2019. Surveys indeed find a striking generational share gap with half (50%) of older Millennials (25-34) drinking craft beer, in contrast with 36% of US consumers overall. As with other CPGs, Millennials may value the perception of higher quality for craft beer.

The authors manually assembled a novel database from various industry sources that tracks the history of all the craft beer brands sold in the US, which allowed them to exploit the geographic differences in the timing and speed of diffusion of new craft beer brewers and local availability of craft beer. They also employ a national database containing the 2004-2018 purchase activity for a nationally representative shopping panel of over 100,000 U.S. households.
Among other findings, the authors show that 85.3% of the generational share gap is explained by consumption capital. Therefore, while Millennials buy craft beer at higher rates than older consumers, the differences in intrinsic preferences cannot account for the disruption to the market structure of established beer brands. Instead, generational differences in craft beer demand are mostly an artifact of generational differences in the historic availability of brands during early adulthood. Put another way, it is not so much that Millennial beer drinkers have different tastes than, say, Baby Boomers, it is more that Millennials were exposed to craft beers when they entered adulthood.
Importantly for the beer industry, this work suggests sustained growth in craft beer share, reaching almost 30% of the market by 2030, reflecting the changing composition of beer consumers as older generations die and a new generation of new adults—Generation Z—enters the market and forms beer preferences.
-
Economists and policymakers have long embraced the idea that high uncertainty induces households to spend less and firms to reduce investment and employment. However, recent research has shown that the empirical evidence on these channels is at best “suggestive” and that more work is needed to more clearly make this causal link.

This paper addresses this gap by employing randomized control trials in a new large cross-country survey of European households to induce exogenous variation in the macroeconomic uncertainty perceived by households, and to then study the causal effects of the resulting change in uncertainty on their spending relative to that of untreated households. This work is based on a new, population-representative survey of households in Europe implemented by the European Central Bank (ECB). The authors’ survey spans the six largest euro area countries and thousands of households.
The authors find that higher uncertainty leads to sharply reduced spending by households on both non-durables and services in subsequent months as well as on some durable and luxury goods and services. In short, the authors provide direct causal evidence that economists and policymakers can stop hedging their claims about the effect of high uncertainty on household and business spending decisions: Higher uncertainty makes households spend less on average.
Importantly, the authors find that this effect is economically large over a period of several months. In contrast, they find little effect of the first moment of expectations on household spending. A central challenge in the uncertainty literature has been separately identifying the effects of expectations about first and second moments, since most large uncertainty events are also associated with significant deteriorations in the expected economic outlook. The authors’ results suggest that, at least when it comes to households, it is uncertainty that is driving declines in spending rather than concerns about the expected path of the economy.
These declines in spending stemming from rising uncertainty mainly regard discretionary spending, such as health and personal care products and services, entertainment, holiday, and luxury goods. Spending is most affected by uncertainty for those individuals working in riskier sectors, as well as households whose investment portfolios are most exposed to risky financial assets. They also find that when individuals face higher uncertainty, they report that they would be less likely to allocate new financial investments to mutual funds or cryptocurrencies. On the other hand, they show that (exogenously induced) uncertainty does not influence household attitudes towards investing in real estate.
The views expressed in this paper are those of the authors and do not necessarily reflect the views of the European Central Bank or any other institution with which the authors are affiliated.
-
In recent decades, researchers in economics and finance have increasingly adopted experimental and quasi-experimental methods to study the effects of large-scale economic and financial shocks. These methods compare a group of firms or households that are directly exposed to a given shock to an unexposed control group, and which allow the researchers to estimate whether the shock caused any differences in outcomes between treated and control groups.
A shortcoming of these quasi-experimental methods is that they typically do not measure the total effect of a shock. Most studies exclusively estimate the effect of direct treatment, which captures only part of the total effect. The remaining part is driven by spillover effects from directly exposed firms and households to other firms. Firms and households do not experience business or financial shocks in a bubble, in other words, but rather in relation to other households or firms that may have not directly experienced the shock.
These spillovers operate through what economists call general equilibrium channels, including price and wage changes, agglomeration forces, and input-output networks. For instance, researchers interested in the effects of fiscal stimulus might compare firms that receive fiscal support to firms that do not. If stimulus causes directly exposed firms to increase hiring, wages in local labor markets might rise, which affects all firms in the region.
Estimating spillovers is key for researchers because it helps them understand which general equilibrium channels need to be included in economic models, and whether micro data estimates are informative about higher levels of aggregation. For example, consider the economic shocks and the policy responses of the Great Recession or the current pandemic. In such cases, many firms and households are simultaneously affected, so general equilibrium forces are likely large and operate through many different channels.
Huber’s contribution in this paper is threefold:
- First, he outlines how researchers can estimate spillovers operating among firms and households that are connected in some way, for example firms in the same region, sector, or network.
- Second, he highlights three issues that can introduce mechanical bias into spillover estimates: multiple types of spillovers, measurement error, and nonlinear effects. Or to put it simply: spillovers are complicated. For instance, spillover estimates are biased when researchers do not account for the fact that spillovers may operate simultaneously across multiple groups, such as when a shock to firms generates spillovers both onto firms in the same region and same sector.
- Third, Huber proposes practical solutions to these estimation challenges, such as instrumental variables, testing for heterogeneous effects, and flexible functional forms.
Building models that closely approximate reality is important for researchers as they try to determine the effects, in this case, of economic shocks and the policies prescribed to address them. By estimating spillovers directly, researchers can contribute to the development of realistic general equilibrium models and, thus, improve their understanding of the connection between micro data and aggregate outcomes. While seemingly abstract, these improvements in models can make important contributions to our understanding of how the economy works.
-
Ever since Gary Becker’s path-breaking 1957 work on discrimination, when he introduced the profession to a simple framework for racial bias and its effect on the outcomes of white and Black individuals, economists have built a variety of theoretical models that try to explain the existence of discrimination. In recent years, some researchers have taken a more empirical view of the matter and parsed rich administrative data to find evidence for discrimination in different settings. It is sometimes unclear, however, how this recent empirical literature relates to the classic theoretical framework of Becker and others.
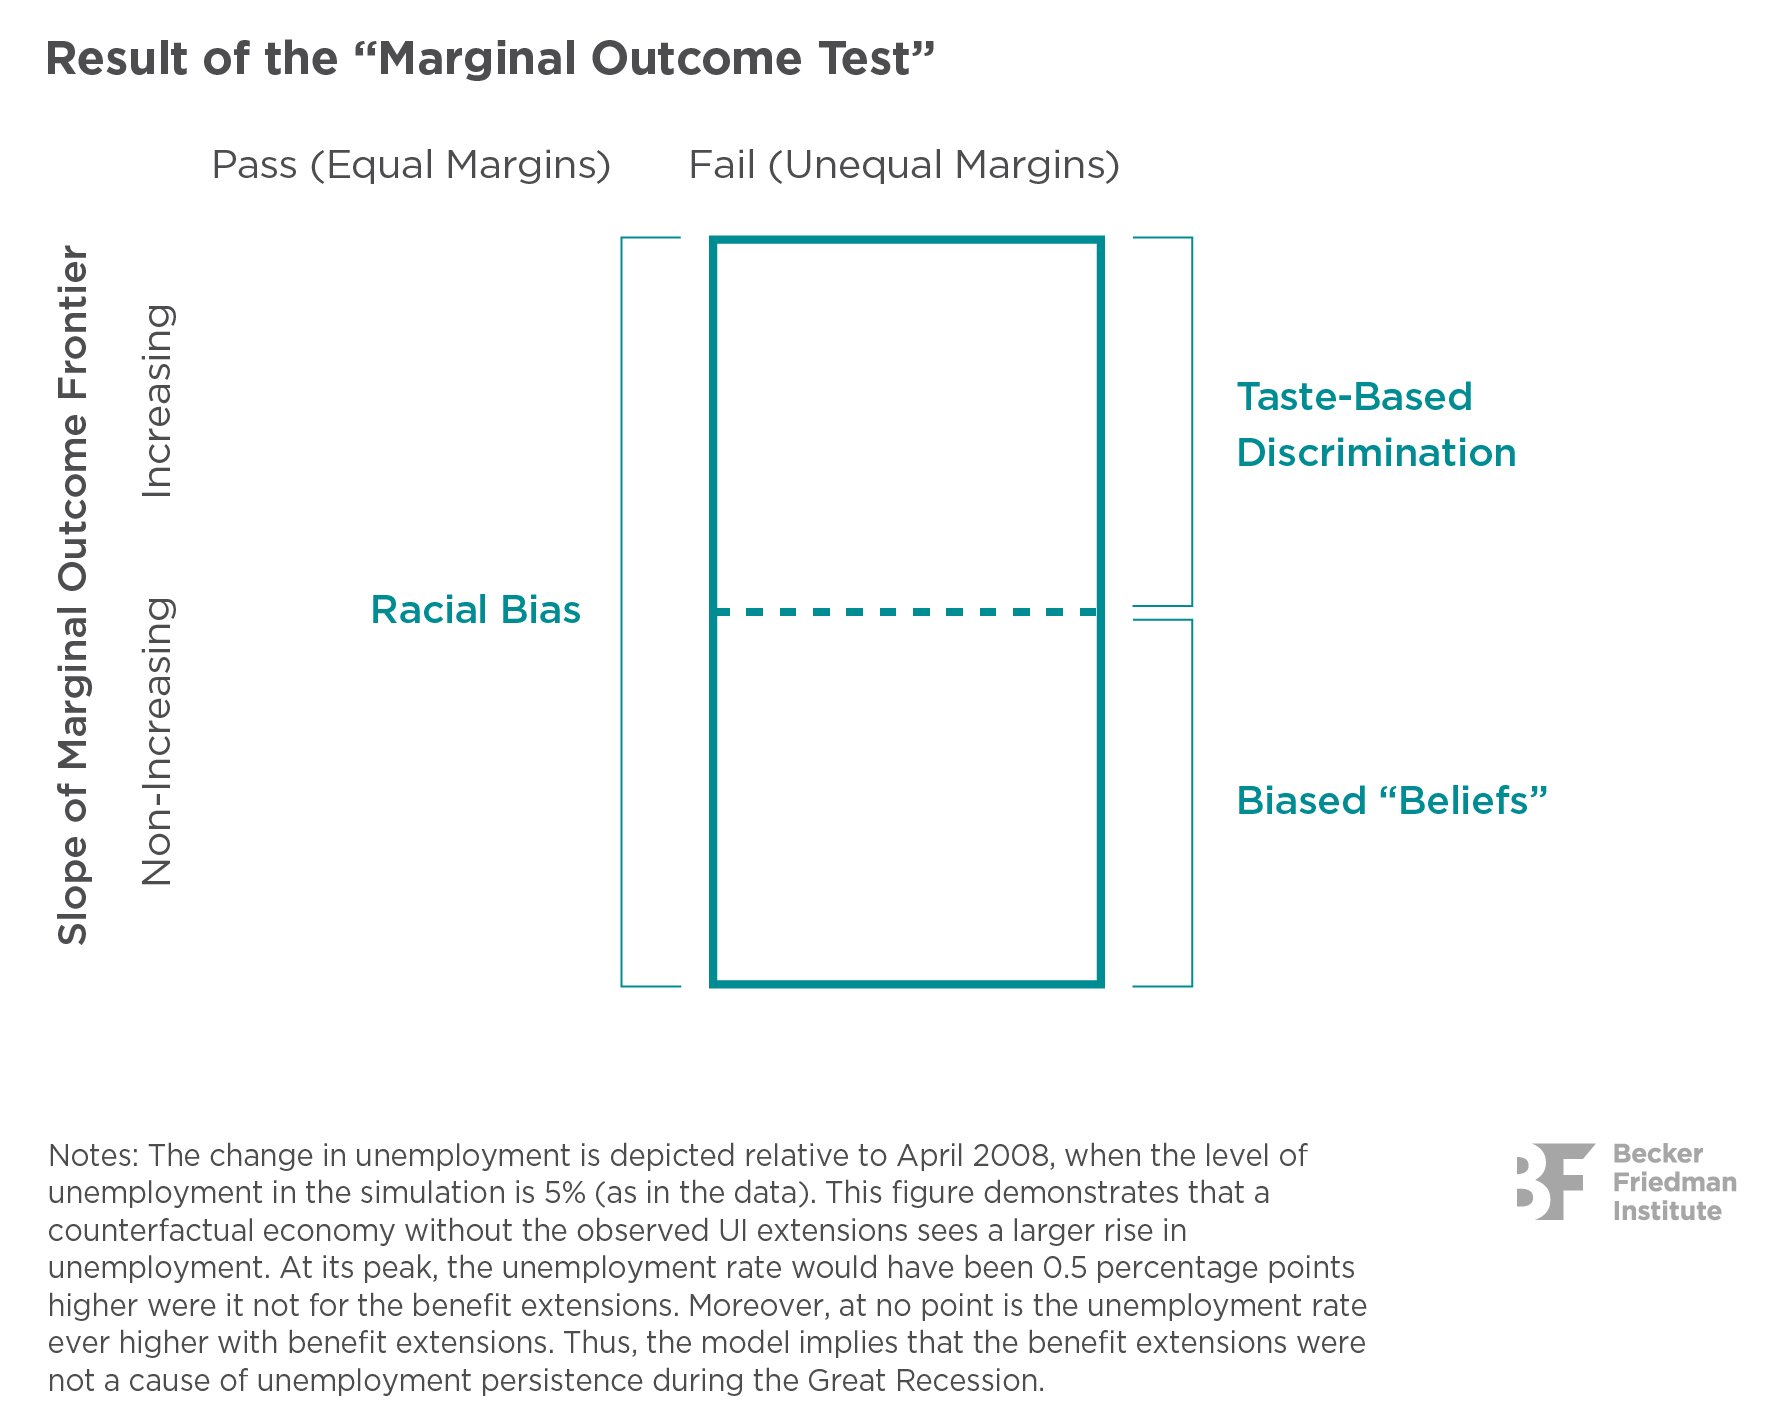
In this new work, Peter Hull of UChicago’s Kenneth C. Griffin Dept. of Economics offers a reconciliation of these two literatures, developing a framework for understanding modern tests of decision-making in terms of racial bias. In doing so, Hull shows how modern empirical tests can detect different forms of bias, from canonical taste-based discrimination to inaccurate beliefs or stereotypes, and offers a new approach to distinguish between the two.
Imagine a judge who must decide which defendants to release on bail before trial, with defendants assigned effectively at random to different judges. A recent empirical literature uses such variation to compare the criminal misconduct outcomes of white and Black defendants who a judge is just indifferent to releasing. Inspired by the theory of Gary Becker, racial disparities “at the margin” of treatment may suggest “taste-based discrimination,” in which judges hold Black defendants to a different standard than perceivably equal white defendants. But more recent theory may suggest other explanations, such as that the judge is acting on biased beliefs about a defendant’s potential for criminal misconduct, or racial stereotypes.
It is theoretically possible, in other words, that a judge with different “marginal outcomes” for white and Black defendants harbors no racial animus, but makes systematic decision-making mistakes that favor white defendants. In practices, judges may base their decisions on inaccurate predictions of defendant misconduct risk after reviewing facts about the defendant’s background and prior criminal behavior and other factors. Are these “bad guesses” necessarily evidence of racial bias?
Hull finds that the answer to that question is “No.” Differences in decision-making at the margin can reject the possibility that a judge is basing decisions on accurate predictions of misconduct risk in a risk-neutral way. But this does not mean the judge is engaged in canonical taste-based discrimination. Instead, this finding from the “marginal outcome tests” in the recent empirical literature could be attributed to a judge’s biased beliefs or, more prosaically, their systematic mistakes in predicting whether individual defendants of different races will commit pre-trial crimes.
Hull then offers a new test to disentangle taste-based discrimination from mistaken judgment. This test relies not on the outcomes of white and Black defendants just at the margin of a judge’s decision, but how these marginal outcomes change as a judge becomes more or less lenient. Concretely, imagine that our judge has some sort of internal prediction of pretrial misconduct that she uses to rank white and Black individuals by her desire to release them before trial. If a defendant falls below some potentially race-specific threshold, the defendant is released before trial, while defendants with high misconduct predictions are detained. Currently, researchers look at the outcomes of individuals at these thresholds to determine whether or not a judge is racially biased.
Hull’s insight is to also consider how the misconduct outcomes change as that threshold point moves. In other words, are the judge’s bail decisions resulting in fewer or more crimes at the margin as she releases more or fewer defendants? Hull shows that if marginal outcomes always increase, by race, as more defendants are released then one cannot reject Becker’s classic model of taste-based discrimination. If, however, marginal outcomes do not increase with release rates then it is likely she is just making mistakes.
Importantly, Hull stresses that data can only reveal so much about a person’s intentions. Any conclusions that his test reveals about taste-based discrimination and biased beliefs in a judge’s pre-trial bail decisions, for example, reflect what can be said about the judge’s behavior from her actions, and not necessarily her “true” or intended behavior. The paper nevertheless argues that the results of these empirical tests can be very useful for policymaking.
This work unites classic theoretical framework of racial bias and recent empirical research in several settings, both within and outside of the pretrial setting and criminal justice as a whole. On one hand, Hull shows that existing marginal outcome tests have limits in detecting the canonical taste-based discrimination model of Gary Becker. On the other hand, he shows that a new test which more fully characterizes marginal outcomes can provide a more complete view of racial bias. The paper discusses how both tests can be applied in various settings, and summarizes directions for future empirical work.
-
In the wake of a series of tragic incidents in recent years, police reform has become a central societal concern. This new research documents how LAPD officers responded to police reforms, and focuses on three key dates: 1998, when the first reform was introduced, which triggered an internal investigation for every complaint; 2001, when the Department of Justice ordered better documentation and more timely compliance; and 2002, when reforms were weakened such that commanding officers could dismiss complaints deemed frivolous.

How does such a dynamic play out in the data? The arrest-to-crime rate fell enormously after the first oversight change: by 40 percent from 1998 to 2002 for all crimes (those with victims, known as Part 1, and victimless, Part 2), and by 29 percent for Part 1 crimes. When oversight was reversed in late 2002, arrest rates immediately increased and the rate for all crimes returned to its 1998 level by 2006. The Part 1 arrest rate reversed by half of the initial decline. Prendergast interprets these outcomes as evidence of “drive and wave” disengagement, and he cites contemporaneous officer reports that corroborate this description. Of note, there were no such changes in arrest rates for neighboring jurisdictions of the Los Angeles Sheriff’s Department over the same period.
To test or check his “drive and wave” hypothesis, Prendergast first looks at differences across crimes to see if officers appropriately respond and investigate. For Part 1 crimes, which have victims (say, a burglary or assault), officers are more inclined to respond, especially as these cases are typically called into a station, leaving a record. By contrast, Part 2 crimes, (like narcotics and prostitution) often rely on the officer witnessing the crime. In line with Prendergast’s “drive and wave” insight, narcotics arrests fall 44 percent from 1998 to 2001, and then increase by that amount afterwards.
By failing to investigate crimes in a way that led to arrests, police harmed the victims of those crimes. Prendergast argues that the oversight changes created an imbalance in which the voice of victims in police oversight was largely ignored. This observation offers implications for the current debate on police reform. In particular, it shows that enhancing oversight by suspects without strengthening the voice of victims may backfire.
-
To support economies hit by the pandemic, governments have implemented large fiscal stimulus programs, but these programs have come at a steep price. In 2020, the advanced economies on average created extra public debt equaling 20 percent of GDP, pushing average debt-to-GDP to heights not seen since WWII. These exceptional debt levels are raising questions about how governments will ultimately finance them. Will such high levels require countries to inflate away part of their debts? Will individuals raise their inflation expectations and fuel an inflationary cycle?
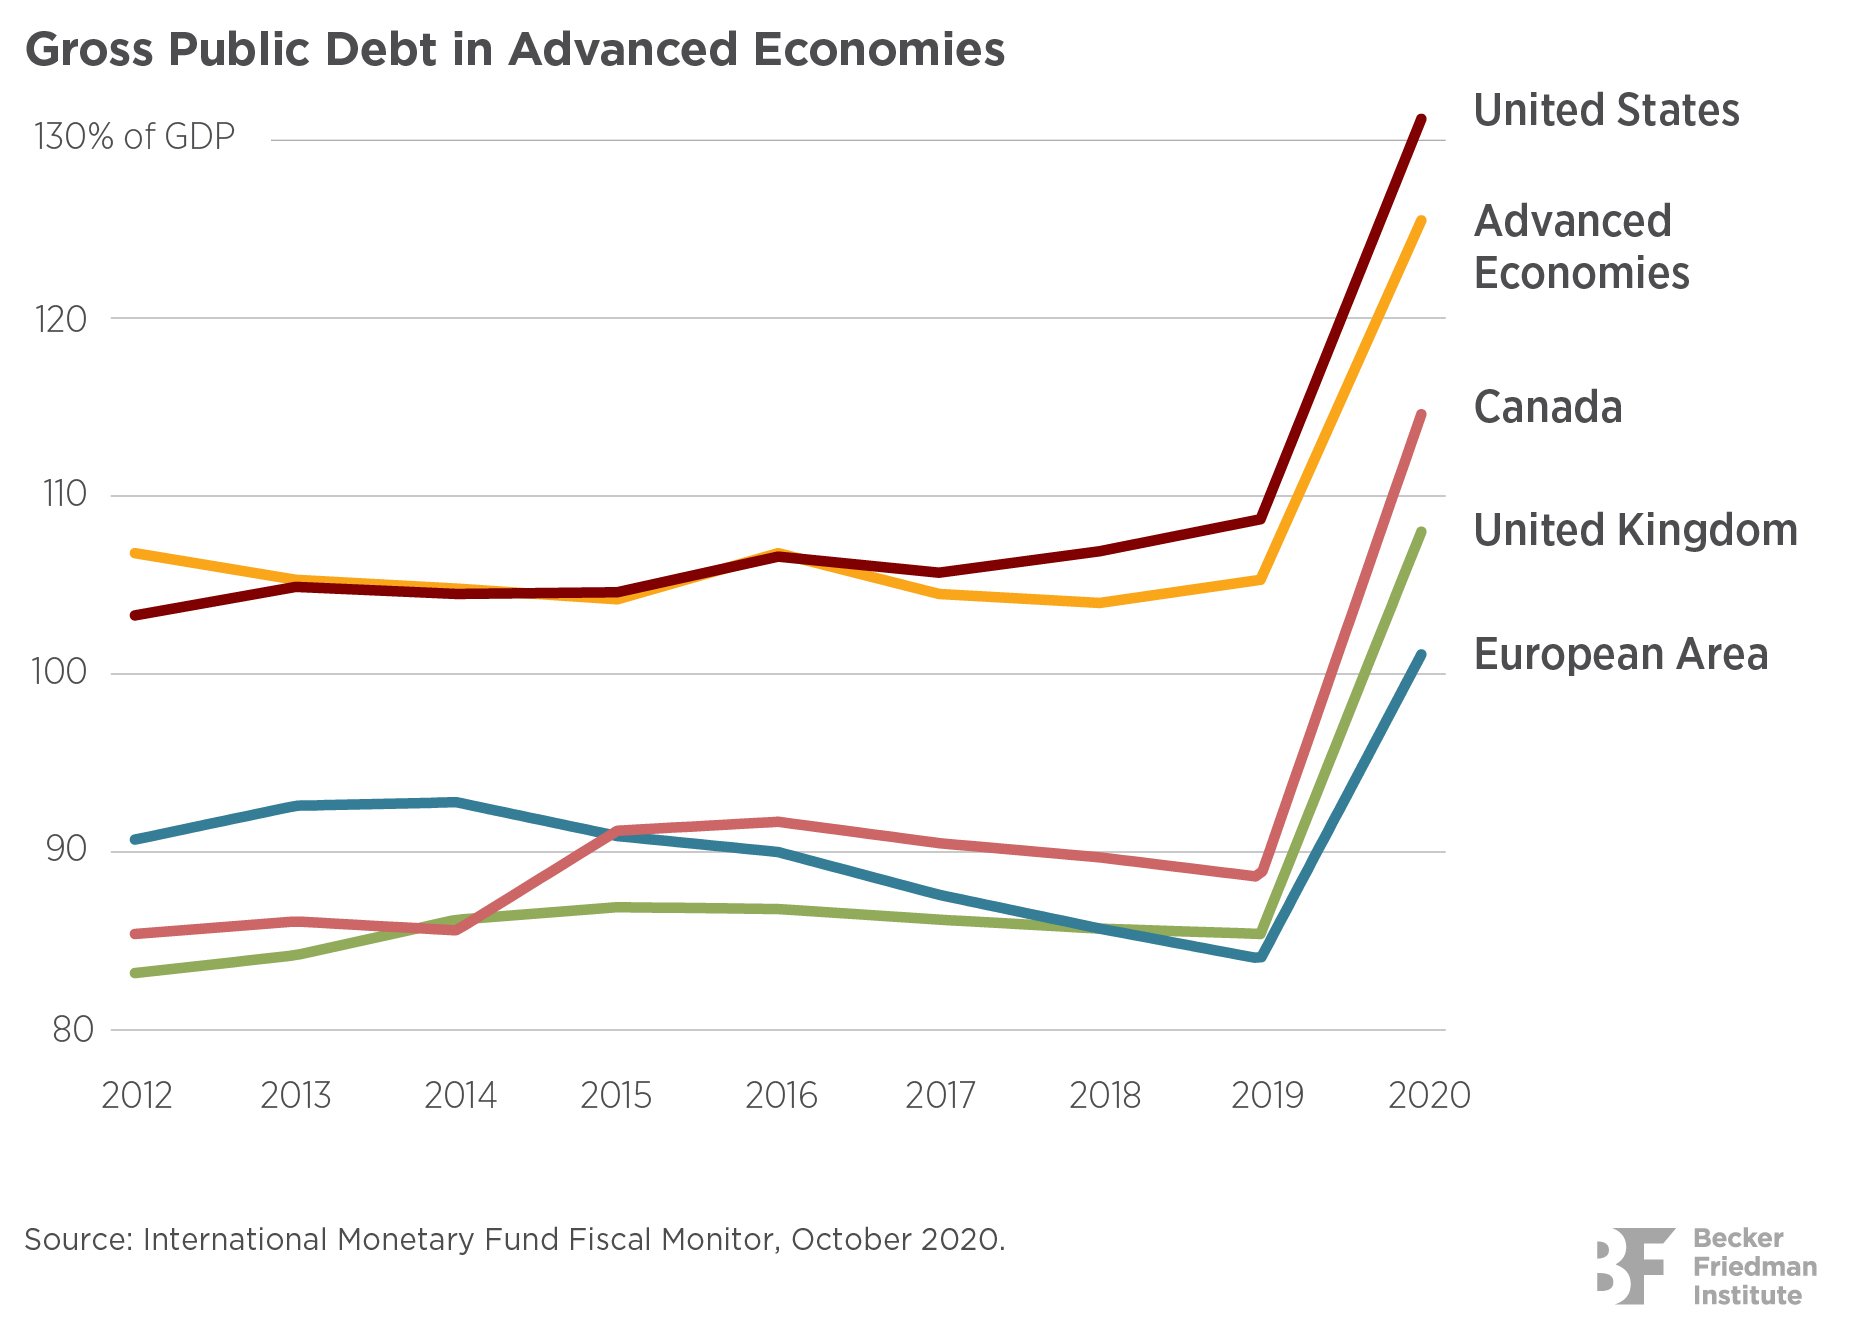
While theory suggests that fiscal considerations may play an important role in driving inflation expectations, little empirical evidence exists on the matter. To address this empirical gap, the authors use a large-scale survey of US households that assesses whether households’ inflation expectations react to certain financial information. Some information relates to current levels of deficits and debt whereas other information focuses on projected levels of debt in the future.

The authors find that current levels of deficits and debt have essentially no effect on inflation expectations of households, nor does such information affect their expectations of the fiscal outlook. However, providing households with information about public debt expectations in a decade has more pronounced effects, summarized here:
First, households incorporate this information into their outlook and raise their expectations about future debt levels.
Second, they seem to assume that much of the rising debt levels will come from higher spending on the part of the government.
Third, they anticipate higher inflation, both in the short-run and over the next decade, in response to this information.
These results suggest that households are able to distinguish between transitory fiscal changes and more permanent ones. Information about current fiscal levels does not seem to affect their broader outlook about the fiscal situation, including for future interest rates and inflation. But information about future changes in public debt, perhaps because they are indicative of more permanent changes in the fiscal outlook, leads households to anticipate some monetization of the debt.
This work offers important insights for current policymakers. Most households do not perceive current high deficits or current debt as inflationary, nor as being indicative of significant changes in the fiscal outlook. However, a persistently worsening fiscal outlook, with rising debt levels into the future, does seem to have a more powerful effect on expectations, including inducing households to expect some monetization of the future debt.
-
College students often seek information from business professionals about career choices that those professionals have made. Research has revealed that these informal exchanges are important, as they can alter students’ career expectations and choices. However, do all college students receive similar responses? This working paper is a first-of-its-kind exploration into whether student gender causally affects the information that students receive regarding various career paths.

The authors implemented a large-scale field experiment wherein undergraduate students interested in learning about various careers sent messages via an online professional platform. The messages, sent by students to 10,000 randomized recipients, asked preformulated questions seeking information about the professional’s career path. Four templates, based on university career center guidance, were used to test a specific hypothesis regarding whether gender influenced the type of information received by a student. The authors focused on two career attributes—work/life balance and competitive culture—both of which differentially affect the labor market choices of women.
The authors’ main finding is that gender was a key determinant of the type of information that professionals provided to students regarding work/life balance. In response to the broad question about the pros/cons of the professional’s field, the text of the responses reveals substantial gender disparities. Professionals are more than two times as likely to provide information on work/life balance issues to female students relative to male students.
Further, when students ask specifically about work/life balance, female students receive 28 percent more responses than male students. This means that the differential emphasis on work/life balance to female students in responses to the broad question is not entirely driven by perceptions that female students care more about this issue. Interestingly, there is no differential emphasis on workplace culture to female students.
These different answers to male and female students matter: The vast majority of these mentions of work/life balance are negative and increase students’ concern about this issue. At the end of the study, female students report being more deterred than male students from their preferred career path, and this is partly explained by the greater emphasis on work/life balance to female students.
-
Private equity (PE) has played an increasing role in health care management in recent years, with total investment increasing from less than $5 billion in 2000 to more than $100 billion in 2018. PE-owned firms provide the staffing for more than one-third of emergency rooms, own large hospital and nursing home chains, and are rapidly expanding ownership of physician practices. This role has raised questions about health care performance as PE-owned firms may have incentives more aligned with firm value than with consumer welfare.

This work focuses on PE and US nursing homes, a sector with spending at $166 billion in 2017 and projected to grow to $240 billion by 2025. Nursing homes have historically had a high rate of for-profit ownership (about 70%), allowing the authors to study the effects of PE ownership relative to for-profit ownership more generally. Also, PE firms have acquired both large chains and independent facilities, enabling the authors to make progress in isolating the effects of PE ownership from the related phenomenon of corporatization in medical care.
The authors employ patient- and facility-level administrative data from the Centers for Medicare & Medicaid Services (CMS), which they match to PE deal data to observe about 7.4 million unique Medicare patients. The data include 18,485 unique nursing homes between 2000 and 2017. Of these, 1,674 were acquired by PE firms in 128 unique deals. Their findings include the following:
- Going to a PE-owned nursing home increases the probability of death during the stay and the following 90 days by 1.7 percentage points, about 10% of the mean. This estimate implies about 20,150 Medicare lives lost due to PE ownership of nursing homes during the authors’ sample period.
- The authors estimate a corresponding implied loss in life-years of 160,000. Using a conventional value of a life-year from the literature, this estimate implies a mortality cost of about $21 billion in 2016 dollars, or about twice the total payments made by Medicare to PE facilities during our sample period, about $9 billion.
- The total amount billed for both the stay and the 90 days following the stay increases by about 11%.
- Nurse availability per patient declines, and there is an increase in operating costs that tend to drive profits for PE funds.
- Finally, attending a PE-owned nursing home increases the probability of receiving antipsychotic medications—discouraged in the elderly due to their association with greater mortality—by 50%. Similarly, patient mobility declines and pain intensity increases post-acquisition.
The authors acknowledge that although their results imply that PE ownership reduces productivity of nursing homes, such ownership may have more positive effects in other sectors of healthcare with better functioning markets. Further work is needed to determine how government programs can be redesigned to align the interests of PE-owned firms with those of taxpayers and consumers.
-
What are the private and social costs and benefits of electric vehicles (EVs)? Data limitations have hindered policymakers’ ability to answer those questions and guide transportation electrification. Most EV charging occurs at home, where it is difficult to distinguish from other end uses, meaning published estimates of residential EV load are either survey-based or extrapolated from a small, unrepresentative sample of households with dedicated EV meters.

These data are important because if EVs are driven as much as conventional cars, it speaks to their potential as a near-perfect substitute to vehicles burning fossil fuels. If, on the other hand, EVs are driven substantially less than conventional cars, it raises key questions about their replacement potential.
This research presents the first at-scale estimates of residential EV charging load in California, home to approximately half of the EVs in the United States. The authors employ a sample of roughly 10 percent of residential electricity meters in the largest utility territory, Pacific Gas & Electric, which they merge with address-level data on EV registration records from 2014-2017. The authors’ findings include:
- EV load in California is surprisingly low. Adopting an EV increases household electricity consumption by 0.12 kilowatt-hours (kWh) per hour, or 2.9 kWh per day. Given the fleet of EVs in their sample and correcting for the share of out-of-home charging, this translates to approximately 5,300 electric vehicle miles traveled (eVMT) per year.
- These estimates are roughly half as large as official EV driving estimates used in regulatory proceedings, likely reflecting selection bias in official estimates, which are extrapolated from a very small number of households.
- Importantly, these findings indicate that EVs are driven substantially less than internal combustion engine vehicles, suggesting that EVs may not be as easily substituted for gasoline vehicles as previously thought.
This work is an important step in determining EV utilization rates, and the authors map out future research efforts that include, among other questions, issues relating to the marginal utility of EV transportation, such as limited charging stations; the degree to which EVs complement rather than replace conventional vehicles; and the impact of high electricity prices in California.
-
Much of income redistribution generated by the US tax system occurs through large tax credits paid out in annual tax refunds, such as the Earned Income Tax Credit (EITC) and Child Tax Credit (CTC). These credits are a substantial portion of income for many recipients, but complexity may lead to uncertainty about tax liability or refund status, even after other income-related uncertainty is resolved.

The authors employ novel survey data about tax filer beliefs to find the following:
- There is substantial tax-refund uncertainty among low-income filers, and among EITC recipients in particular.
- Despite considerable uncertainty, filers’ expectations are often correct, and they seem to update their beliefs from year to year in response to new information.
- Uncertainty may stem from more complex features of the tax code, such as the phase-in and phase-out regions for tax-based transfer programs or rules for married tax filers.
- Finally, refund uncertainty distorts individuals’ consumption-savings choices and is large enough to cause welfare losses among EITC filers on the order of 10 percent of the value of the EITC.
These are important insights for policymakers, but the authors acknowledge that more work is needed to better understand the underlying mechanisms that influence low-income tax filers. For example, a better understanding of why households fail to resolve uncertainty could inform the design of tax simplification policies, and could help predict behavioral responses to, and welfare consequences of, other tax reforms. Tax-related uncertainty may also affect other economic decisions, such as whether and how much to work.
-
Human capital theory has offered insights on the nature and causes of inequality in personal incomes by focusing on such measures as years of schooling completed and education’s relationship to labor market outcomes. One line of research has explored individual choices, for example, regarding education, while another branch has investigated determinants of human capital, such as standardized tests that signal potential skills for employers. To date, economics research and related work in the contemporary psychology of education literature are dominated by an empirical and theoretical focus on the individual.

In contrast, this working paper explores a new line of economics research that incorporates insights from sociology, which is concerned with explaining human phenomena through group settings, including how such interactions shape individuals and their choices, such as those that augment human capital.
The authors apply this analytical lens to a series of early childhood programs delivered to low-income families in Chicago’s South Side. The goals of the intervention were to examine how investing in cognitive and non-cognitive skills of low-income children aged 3 to 4 affects their short- and long-term outcomes, and to evaluate the effectiveness of investing directly in the child’s education versus indirectly through the parents. To that end, families of over 2,000 disadvantaged children were randomized into (i) an incentivized parent-education program, (ii) a high-quality preschool program (Pre-K), or (iii) a control group. The children’s cognitive and non-cognitive skills were assessed on a regular basis, starting before the randomization and continuing into the middle and end of the programs. Follow-up assessments were also conducted on a yearly basis.

Exploring insights from sociology to focus on explorations of group interactions, the authors find:
- Large and significant spillover effects on both cognitive and noncognitive skills, with non-cognitive spillover effects about two times larger than the cognitive spillover effects. Interestingly, the spillover effects are localized and fall rapidly as the distance to a treated neighbor increases.
- Non-cognitive spillover effects are significantly larger for Blacks than Hispanics, with no significant racial differences in cognitive spillover effects. Regarding gender, the authors’ estimates suggest that boys tend to benefit more than girls from cognitive and non-cognitive spillovers, although these gender differences are not significant at the conventional levels.
- Program effects spill over through two main channels: direct social interactions between children who were randomized during the intervention, and parental interactions.
Given the importance of non-cognitive skills in children’s future labor market and educational outcomes, these findings provide practical insights into designing early interventions to better foster such skills. Specifically, this research suggests that interventions that promote social interactions both within participants and between participants and non-participants are likely to generate larger positive externalities on non-cognitive skills. This research also offers insights to policymakers interested in the science of scaling programs.
-

Discrimination against Arab-Muslims in the United States, including violence and hate speech, has grown substantially over the past five years. But there is hope, and it lies with more contact between Arab-Muslims and non-Muslim Whites, not less. This new research studies the effect of decades-long exposure to local Arab-Muslim communities on non-Muslim Whites’ attitudes and behaviors, using a strategy based on immigration “pull” and “push” factors to isolate a causal effect rather than a simple correlation.
The authors combine three cross-county datasets, individualized donations data from two large charity organizations, and a recent large-scale custom survey to show that:
- Long-term exposure leads to more positive attitudes. Non-Muslim Whites who reside in US counties with (exogenously) larger populations of Arab ancestry are less explicitly and implicitly prejudiced against Arab-Muslims.
- These effects carry over into measures of political preferences: non-Muslim Whites in these same counties were more opposed to the 2017 “Muslim Ban” and less likely to vote for Donald Trump in 2016.
- Individuals in these counties are more likely to donate, and donate larger sums, to charitable causes in Arab countries.
- Finally, individuals in these counties are more likely to have an Arab-Muslim friend, neighbor, or workplace acquaintance, less likely to hold negative beliefs about Islam, and more knowledgeable about Arab-Muslims and Islam in general.
The authors then take their analysis one step further, showing that these effects are not unique to Arab-Muslims: decades-long exposure to any given foreign ancestry increases generosity toward that ancestral group. Their results provide compelling evidence on the importance of diversity: increasing contact between different groups in natural settings can pay long-run dividends by promoting tolerance, social cohesion, and pluralism.
-
Personal digital devices generate streams of detailed data about human behavior. Their temporal frequency, geographic precision, and novel content offer social scientists opportunities to investigate new dimensions of economic activity.

The authors find that smartphone data cover a significant fraction of the US population and are broadly representative of the general population in terms of residential characteristics and movement patterns. They produce a location exposure index (“LEX”) that describes county-to-county movements and a device exposure index (“DEX”) that quantifies the exposure of devices to each other within venues. These indices track the evolution of intercounty travel and social contact from their sudden collapse in spring 2020 through their gradual, heterogeneous rises over the following months.
Importantly for researchers, the authors are publishing these indices each weekday in a public repository available to noncommercial users for research purposes. Their aim is to reduce entry costs for those using smartphone movement data for pandemic-related research. By creating publicly available indices defined by documented sample-selection criteria, the authors hope to ease the comparison and interpretation of results across studies.

More broadly, this work provides guidance on potential benefits and relevant caveats when using smartphone movement data for economic research. Researchers in economics and other fields are turning to smartphone movement data to investigate a great variety of social science questions, and the authors focus on the distinctive advantages of the data frequency and immediacy.
-
Animation: Four Wednesdays Before and Day of Insurrection
Notes: Figure shows origin and trajectories of mobile devices who visited the Capitol CBG, on the Wednesday of the storming of the Capitol and the 4 Wednesdays preceding. Orange dots indicate the lat-long coordinates of the origin CBGs of the devices, turquoise lines show their shortest-distance trajectory. All figures are produced with identical visualization settings (transparency of lines, etc.). Green boxes in last figure mark the location of Proud Boys chapters, a prominent far-right hate group, according to the Southern Poverty Law Center. They correspond to the lat-long coordinates of the centroids of the city the chapter is in.
The authors propose a method to better understand what triggers collective action, and they apply that methodology to the protest and subsequent violent attempt to undermine democratic norms and institutions that occurred on Jan. 6, 2021, in Washington, DC. The authors provide evidence that socio-political isolation, proximity to a prominent hate group, the Proud Boys, as well as the intensity of local misinformation posts on social media were robustly associated with participation in this event.
While existing work yields important insights about the conditions under which organized opposition emerges and what impact such opposition may have on the various institutions within which they are embedded, it tells us little about the individuals that participate in these behaviors. This is due, in large part, to data limitations: It is difficult to characterize those engaged in collective action in a rigorous and representative manner
This paper addresses that data gap through two central contributions:
- This work introduces an approach for estimating community-level participation in mass protest that leverages historical information about cell-phone device movement—anonymized and aggregated—to identify devices that visit places where protests or other types of collective action have occurred. The authors also characterize communities where the devices originate.
- The authors then apply this approach to the Jan. 6, 2021, rally, protest, and subsequent violent riot on the grounds of the United States Capitol building, the aim of which was to oppose or halt the official certification of the outcome of the November 2020 US presidential election. The authors’ methodology helps them address a key question: What are the conditions under which individuals may engage in such anti-democratic acts? The authors find that partisanship in the form of Trump support, socio-political isolation, proximity to local chapters of the hate group Proud Boys, as well as local engagement with online misinformation through the social-media platform Parler, explain variation in protest involvement.
-

Of all the challenges that poverty presents, one that is gaining increased attention from researchers is that poverty itself can have psychological effects that lead to decreased earning potential. Living in poverty—with the stresses and traumas that such a state causes—can negatively impact a person’s ability to work productively and earn a high wage.
To test this connection between poverty and productivity, the authors conduct a field experiment with 408 small-scale manufacturing workers in Odisha, India. The workers are employed full-time for a two-week contract job—a typical form of employment. These workers make disposable plates for restaurants, a physical yet cognitively demanding task for which payment is tied to output. The authors’ experiment is set during the lean season when people are typically strapped for cash. For example, at baseline, 71% of workers in their sample have outstanding loans, and 86% report having financial worries. Workers appear to carry their mental burdens to work. On a typical work day, roughly one in two workers reports worrying about finances while at work.
The experiment randomly varies the timing of income receipt so that some workers are paid sooner with an amount roughly equal to one month’s earnings. This large cash infusion appears to immediately reduce financial constraints: within three days, early-payment workers are 40 percentage points (222%) more likely to repay their loans. Only the timing of payment changes; the piece rate and all other aspects of the job are unchanged, meaning that short-term financial concerns are reduced without affecting overall wealth or financial incentives to work. This enables the authors to measure an immediate effect of cash-on-hand on productivity.
The major findings are as follows:
- Alleviating financial constraints boosts worker productivity. The day after receiving a cash infusion, workers are 0.12 standard deviations (SDs) more productive relative to the control group.
- These gains persist throughout the workday and for the remaining days of the treatment period.
- The gains are concentrated among more financially strained workers, measured both by assets and liquidity. Early payment increases productivity for these poorer workers by 0.22 SDs.
- Early payment also improves poorer workers’ attentiveness on the task, as measured by three different markers of inefficient production processes.
For policymakers, this work suggests that programs that reduce financial volatility or vulnerability for poor workers could increase their productivity in addition to improving their welfare.
-

The nature of business lending in an economy changes over a financial cycle, including the amount and type of debt that a borrower can take, as well as the role of banks and other lenders involved. Not only does this affect borrowing by firms, it also affects the capital structure of intermediaries. While much research has examined various aspects of lending, there is relatively little theory explaining how easy financing conditions might accentuate certain aspects over others. In this paper, the authors offer a theory explaining why and how the nature of lending changes with the environment in which lending takes place.
The authors’ model describes the various factors that affect outcomes, including exogenous factors like broad economic and financial conditions, and endogenous factors like improvements in firm governance. To summarize their main findings: Starting from a low level, higher prospective corporate liquidity will initially reduce monitored borrowing from a bank in favor of arm’s length borrowing, and eventually reduce the need for internal corporate governance to support corporate borrowing, leading to covenant-lite loans. In parallel, higher prospective corporate liquidity will allow both corporations and banks to operate with higher leverage.
Beyond these insights into financial intermediation, the authors’ work sheds light on the role of liquidity in diminishing the consequences of moral hazard over repayment, and hence the quality of the corporation’s internal governance. For example, internal governance matters little if the firm can potentially be seized and sold for full repayment in a chapter 11 bankruptcy, which happens in an environment with high levels of liquidity. Therefore, prospective liquidity encourages leverage at both the borrower and intermediary level, even while requiring less governance. Equivalently, because the intermediary performs fewer useful functions, high prospective liquidity encourages disintermediation.
Risky loans to highly leveraged borrowers, made by highly leveraged intermediaries, may therefore not be evidence of moral hazard or over-optimism, but may simply be a consequence of high prospective liquidity crowding out the monitoring role of financial intermediation. Such crowding out may have adverse consequences. As prospective liquidity fades and the demand for intermediation services expands again, the need for intermediary capital also increases. To the extent that intermediary capital is run down in periods when liquidity is expected to be plentiful, it may not be available in sufficient quantities when liquidity conditions turn and demand for capital ramps up. Prospective liquidity breeds a dependence on continued liquidity for debt enforcement as it crowds out other modes of enforcement, especially corporate governance. This will make debt returns more skewed – that is, enhance the possibility of very adverse outcomes along with good ones.
-
Outsourcing is fundamentally changing the nature of the labor market. During the last two decades, firms have increasingly contracted out a vast array of labor services, such as security guards, food, and janitorial services. While good for business, employees of contracting firms earn less than those working for traditional employers.

However, is that the whole story? To the extent that firms scale up more efficiently by contracting out certain activities, outsourcing generates aggregate output gains that may benefit all workers. Despite the prevalence of outsourcing in the labor market, there is little guidance to trace out its determinants and effects. Why do firms outsource? How can low-paying contractor firms
co-exist with high-paying traditional employers? How does outsourcing change aggregate production and its split between workers and firms?To answer these questions, the authors employ theory, a general equilibrium model, and four sources of French data between 1996 and 2007 that include tax records reflecting firm and worker outcomes, firm surveys, and cross-border trade transactions to provide direct empirical support of the theory. The authors argue that it is useful to conceptualize firms’ outsourcing decisions in the context of frictional labor markets, which give rise to firm wage premia. More productive firms are then more likely to outsource, which raises output at the firm level. Labor service providers endogenously locate at the bottom of the job ladder, implying that outsourced workers receive lower wages. Together, these observations characterize the tension that outsourcing creates between productivity enhancements and redistribution away from workers.
This is confirmed by the authors’ findings:
- A reduced-form instrumental variable strategy confirms that, as firms grow, they spend relatively more on outsourced labor, and outsourcing further improves growth. However, outsourced workers also experience large wage drops.
- At the aggregate level, output rose by 1%, as the structural model reveals that labor was effectively reallocated to the most productive firms in the economy. However, these productive gains were unevenly distributed. Low-skill workers, who were particularly exposed to outsourcing, were increasingly employed at contractor firms who paid low wages.
- In addition, wages declined even at traditional employers because traditional employers faced weaker labor market competition for workers.
- Together, these results imply that the labor share declined by 3 percentage points, and aggregate labor income dropped by 2%.
What about those theoretical output gains that could benefit all workers? The authors find that outsourcing leads to some, though modest, positive productivity effects, and that these gains benefit firm owners and deteriorate workers’ labor market prospects.
Bottom line: outsourcing benefits firm owners and deteriorates workers’ prospects in the aggregate.
-
COVID-19 and policy responses to the pandemic have generated massive shifts in demand across businesses and industries. The authors draw on firm-level data in the Atlanta Fed/Chicago Booth/Stanford Survey of Business Uncertainty (SBU)1 to quantify the pace of reallocation across firms before and after the pandemic struck, to investigate what firm-level forecasts in December 2020 say about expected future sales, and to examine how industry-level employment trends relate to the capacity of employees to work from home.

The authors report three pieces of evidence on the persistent re-allocative effects of the COVID-19 shock:
- First, rates of excess job and sales reallocation over 24-month periods have risen sharply since the pandemic struck, especially for sales. The authors focus on rates of “excess” reallocation, which adjust for net changes in aggregate activity.
- Second, as of December 2020, firm-level forecasts of sales revenue growth over the next year imply a continuation of recent changes, not a reversal. Firms hit most negatively during the pandemic expect (on average) to continue shrinking in 2021, and firms hit positively expect to continue growing.
- Third, COVID-19 shifted relative employment growth trends in favor of industries with a high capacity of employees to work from home, and against industries with a low capacity.

1 The SBU is a monthly panel survey of U.S. business executives that collects data on own-firm past, current, and expected future sales and employment. The Atlanta Fed recruits high-level executives to join the panel and sends them the survey via email, obtaining about 450 responses per month. The survey yields data on realized firm-level employment and sales growth rates over the preceding twelve months and subjective forecast distributions over own-firm growth rates at a one-year look-ahead horizon.
-
Countries with large natural-resource endowments are often less developed and more poorly governed than countries with fewer resources, a phenomenon economists and policymakers call the “resource curse”. Corruption plays a central role in the recourse curse because the need to secure access rights to deposits makes resource extraction (i.e., precious metal mining and oil drilling) inherently prone to corruption. While resource extraction might have a positive direct impact on economic activity, the corruption that often accompanies it can divert resources from local development projects, decrease the efficiency of resource allocation, and reinforce extractive political regimes, thereby attenuating the positive growth effects of extractive activities.

However, does this mean that all corruption is bad? Recent research has shown that anti-corruption regulations have deterred investment that otherwise would have occurred. In some countries with inefficient bureaucracies, corruption can provide a gateway to engage in business. Ultimately, the net economic impact of foreign corruption regulation also depends on how much the regulation decreases corruption, what regulated firms do instead of paying bribes, and whether the marginal investments forgone because of the regulation would have had a positive impact on development.
To address these questions, the authors examined changes in economic activity, as measured by nighttime light emissions in African communities near large resource extraction facilities, following an increase in enforcement of the US Foreign Corrupt Practices Act (FCPA) in the mid-2000s. Compared to other measures of economic development (e.g., GDP), luminosity reflects the level of economic activity more broadly, and thus is likely more indicative of the overall well-being of people throughout the community.
The authors find that after 2004 geographic areas with an extraction facility whose owner is subject to the FCPA gradually exhibit higher levels of economic activity relative to areas surrounding extraction sites that are not subject to the regulation. Local perceptions of corruption also significantly decline. The authors find that the observed increase in development and reduction in perceived corruption are driven (at least in part) by a change in how firms in and around the extractive sector behave.
For policymakers, this work suggests that foreign corruption regulation can be an effective instrument for changing corporate behavior and that, despite any increase in the costs of operating in high-corruption-risk countries, anti-corruption regulation originating in developed countries can have a positive impact on growth. This is important because developing countries may not themselves have the institutional strength or political will to address misconduct by multinational corporations.
-
Algorithms guide an increasingly large number of high-stakes decisions, including criminal risk assessment, resume screening, and medical testing. While such data-based decision-making may appear unbiased, there is increasing concern that it can entrench or worsen discrimination against legally protected groups. With algorithmic recommendations for pretrial release decisions, for example, a risk assessment tool may be viewed as racially discriminatory if it recommends white defendants be released before trial at a higher rate than Black defendants with equal risk of pretrial criminal misconduct.

How is it that discrimination can occur through logical, unfeeling, algorithms? The answer is in the data that feed the algorithms. Continuing with the pretrial release example, misconduct potential is only observed among the defendants who a judge chooses to release before trial. Such selection can introduce bias in algorithmic predictions but also complicate the measurement of algorithmic discrimination, since unobserved qualification cannot be conditioned on to compare white and Black treatment.
This paper develops new tools to overcome this selection challenge and measure algorithmic discrimination in New York City (NYC), home to one of the largest pretrial systems in the country. The method builds on previous techniques developed by the author to measure racial discrimination in actual bail judge decisions and leverages randomness in the assignment of judges to white and Black defendants. Applying their methods, the authors find that a sophisticated machine learning algorithm (which does not train directly on defendant race or ethnicity) recommends the release of white defendants at a significantly higher rate than Black defendants with identical pretrial misconduct potential.
Specifically, when calibrated to the average NYC release rate of 73 percent, the algorithm recommends an 8-percentage point (11 percent) higher release rate for white defendants than equally qualified Black defendants. This unwarranted disparity explains 77 percent of the observed racial disparity in release recommendations, grows as the algorithm becomes more lenient, and is driven by discrimination among individuals who would engage in pretrial misconduct if released.
-
Many western economies have seen significant declines in the labor share of income, which has led to calls for worker representation on corporate boards to ensure the interests and views of workers. Recent polls suggest that a majority of American voters support this idea, and leading politicians in the US and the UK are advocating a system of shared governance. However, there is little scientific evidence on whether such shared governance systems have their intended effect.

To address this question, the authors constructed a unique matched panel dataset of all workers, firms, and corporate boards in Norway for the period 2004-2014, allowing the authors to measure the worker representation status of firms and to follow workers over time, even if workers switched firms. Importantly, these rich data combined with institutional features allowed the authors to use a variety of research designs, including
- comparison of different groups of workers before and after a switch between firms with different representation status,
- the ability to incorporate changes in worker compensation in response to idiosyncratic shocks to firm performance,
- an event study analyzing the effect of worker representation,
- and the effects of a law regulating the rights to worker representation as a discontinuous function of firm size.

The authors find that a worker is paid more and faces less earnings risk if she gets a job in a firm with worker representation on the corporate board. However, these gains in wages and declines in earnings risk are not caused by worker representation; rather, the wage premium and reduced earnings risk reflect that firms with worker representation are likely larger and unionized, and that larger and unionized firms tend to both pay a premium and better insure workers against fluctuations in firm performance.
Bottom line: Conditional on the firm’s size and unionization rate, worker representation has little, if any, effect.
This research offers important insight for policymakers. Taken together, these findings suggest that while workers may indeed benefit from employment in firms with worker representation, they would not benefit from legislation mandating worker representation on corporate boards.
-
This paper offers unique insights into the effect of trade on those who own, work for, or sell to the supply chains of global firms that export and import—and those who do not. The authors address questions relating to the impact of such differences in trade exposure on earnings inequality. For example, if a country’s exports and imports were suddenly to drop to zero because of some extreme policy or natural disaster, would its distribution of earnings become more or less equal? In the absence of trade, would the consequences of domestic shocks for inequality be magnified or dampened?

Informing the authors’ analysis is a unique administrative dataset from Ecuador that merges firm-to-firm transaction data, employer-employee matched data, owner-firm matched data, and firm-level customs transaction records. Together with economic theory, this information allowed the authors to measure the export and import exposures of individuals—whether workers or capital owners—across the income distribution and, in turn, to infer the overall incidence of trade on earnings inequality.
The authors’ main empirical finding is that international trade substantially raises earnings inequality in Ecuador, especially in the upper half of its income distribution. In the absence of trade, top-income individuals would be relatively poorer. However, their empirical analysis also implies that the drop in inequality that took place in Ecuador over the last decade would have been less pronounced if its economy had been subject to the same domestic shocks, but unable to trade with the rest of the world.
Further, the authors find that the import channel is the dominant force linking trade to inequality in Ecuador, with gains from trade for individuals at the 90th percentile of the income distribution that are about 11% larger than the median—and up to 27% larger than the median for those at the top income percentile. However, these results also imply that the drop in inequality observed in Ecuador over the last decade would have been less pronounced in the absence of trade. The authors stress that some of these conclusions may not carry over to other contexts. The fact that export exposure is more pronounced in the bottom half of Ecuador’s income distribution, for instance, is more likely to hold in developing countries that, like Ecuador, specialize in low-skill-intensive goods, than in developed countries that do not.
-
Economists have long strived to develop measures of business expectations, but those efforts have provided few direct measures of business-level expectations for real variables beyond qualitative indicators and point forecasts—at least till now.
This paper describes the first results of an ambitious survey of business expectations conducted as part of the Census Bureau’s Management and Organizational Practices Survey (MOPS), the first large-scale survey of management practices in the United States, covering more than 30,000 plants across more than 10,000 firms. Conducted in 2010 and 2015, the size and high response rate of the dataset, its coverage of units within a firm, links to other Census data, and its comprehensive coverage of manufacturing industries and regions makes MOPS a uniquely powerful source of data for analyzing business expectations.

As part of the 2015 MOPS, the authors asked eight questions about plant-level expectations of own current-year and future outcomes for shipments, employment, investment expenditures and expenditures on materials. The survey questions elicited point estimates for current-year (2016) outcomes and five-point probability distributions over next-year (2017) outcomes, yielding a much richer and more detailed dataset on business-level expectations than previous work, and for a much larger sample.
Importantly, 85% of surveyed firms provided logically sensible responses to the authors’ five-point distribution questions, suggesting that most managers could form and express detailed subjective probability distributions. The other 15% were plants with lower productivity and wages, fewer workers, lower shares of managers with bachelor’s degrees, and lower management practice scores and that were less likely to belong to multinational firms. First and second moments of plant-level subjective probability distributions covary strongly with first and second moments, respectively, of historical outcomes, suggesting that the subjective expectations data are well-founded. Aggregating over plants under common ownership, firm-level subjective uncertainty correlates positively with realized stock-return volatility, option-implied volatility, and analyst disagreement about the future earnings per share (EPS) for both the parent firm and the median publicly listed firm in the firm’s industry.
Cross-checking MOPS data with other manufacturing datasets allowed the researchers to match the MOPS forecasts to realized outcomes. Using those realized values, the authors find that forecasts are highly predictive of outcomes. In fact, these forecasts are substantially more predictive than historical growth rates. They also find that forecast errors rise in magnitude with ex ante subjective uncertainty. Forecast errors correlate negatively with labor productivity. Forecast accuracy improves with greater use of predictive computing and structured management practices at the plant, and with a more decentralized decision-making process across plants in the same firm.
-

Using newly collected data of arguably the most horrendous episode of discrimination in human history, the treatment of Jews in Nazi Germany, the authors examined how the removal of senior managers of Jewish origin, caused by the rise of antisemitism in Nazi Germany, affected large German firms. In doing so, they provide insights into the question of how individual managers can affect firm performance, an issue that has long vexed researchers.
The authors collected the names and characteristics of individuals holding around 30,000 senior management positions in 655 German firms listed on the Berlin Stock Exchange, as well as data on stock prices, dividends, and returns on assets. While the fraction of Jews among the German population in the early 1930s was only 0.8%, the authors’ data show that 15.8% of senior management positions in listed firms were held by individuals of Jewish origin in 1932 (whom the authors term “Jewish managers”). Jewish managers had exceptional characteristics compared to other managers in 1932. For example, Jewish managers were more experienced, educated, and connected (by holding positions in multiple firms). After the Nazis gained power, the share of Jewish managers plunged sharply in 1933 (by about a third) and dropped to practically zero by 1938.
This research revealed four main results:
- The expulsion of Jewish managers changed the characteristics of managers at firms that had employed a higher fraction of Jewish managers in 1932. The number of managers with firm-specific tenure, general managerial experience, university education, and connections to other firms fell significantly, relative to firms that had employed fewer Jewish managers in 1932. The effects persisted until at least 1938, the end of the authors’ sample period on manager characteristics.
- The loss of Jewish managers reduced firms’ stock prices. After the Nazis came to power, the stock price of the average firm that had employed Jewish managers in 1932 (where 22% of managers had been of Jewish origin) declined by 10.3 log points, relative to a firm without Jewish managers in 1932. These declines persisted until the end of the stock price sample period in 1943, ten years after the Nazis had gained power.
- Losing Jewish managers lowered the aggregate market valuation of firms listed in Berlin by 1.8% of German GNP. This calculation indicates that highly qualified managers are of first-order importance to aggregate outcomes and that discriminatory dismissals can cause serious economic losses.
- After 1933, dividends fell by approximately 7.5% for the average firm with Jewish managers in 1932 (which lost 22% of its managers). Also, the average firm that had employed Jewish managers in 1932 experienced a decline in its return on assets by 4.1 percentage points. These results indicate that the loss of Jewish managers not only reduced market valuations, but also led to real losses in firm efficiency and profitability.
These findings offer lessons for today. The US travel ban on citizens of seven Muslim-majority countries, for example, or the persecution of Turkish businessmen who follow the cleric Fethullah Gülen, could lead to a loss of talent. Further, the authors note a post-Brexit survey in 2017 revealing that 12% of continental Europeans who make between £100,001 ($130,000) and £200,000 a year planned to leave the United Kingdom. Bottom line: The authors warn that such an exodus, and similar outflows of talented managers, could have meaningful economic consequences.
-
Cybersecurity risk is at the top of many firms’ worry lists, and rightly so. Despite substantial investments in information security systems, firms remain highly exposed to cybersecurity risk, with possible losses amounting to $6 trillion annually by 2021. One open question for researchers has been whether a firm’s exposure to cybersecurity risk is priced into financial markets.

To address this question, the authors developed a firm-level measure of cybersecurity risk for all listed firms in the US, which allowed them to examine whether cybersecurity risk is priced in the cross section of stock returns. The authors analyzed firms that were subject to cyberattacks as a training sample, and then they compared the wording and language in the relevant risk-disclosure section in annual reports of the attacked firms with that of all other firms. They first extracted the discussion on cybersecurity risk in the firms’ 10-K reports from 2007-2018, which contain information about the most significant risk factors for each firm.
Next, they identified a sample of firms that were subject to a major cyberattack (involving lost personal information by hacking or malware-electronic entry by an outside party) in any given year, arguing that those firms have high cybersecurity risk, and which then served as the authors’ training sample. Finally, they estimated the similarity of each firm’s cybersecurity-risk disclosure with past cybersecurity-risk disclosures of firms in the training sample (i.e., from the one-year period prior to the firm’s filing date). The higher the measured similarity in cybersecurity risk disclosure for their sample firms and firms in the training sample, the greater the exposure to cybersecurity risk.

The authors then subject these measures to a number of validations that, in the end, drive their finding that firms with high exposure to cybersecurity risk outperform other firms by up to 8.3% per year. Among other findings, they offer one important caveat: A cybersecurity-mimicking portfolio performs poorly in times of heightened cybersecurity risk and investors’ concerns about data breaches. These results support the predictions of asset-pricing theory that investors require compensation for bearing cybersecurity risk.
-
Many central banks and policymaking institutions around the world are openly debating the introduction of a central bank digital currency, or CBDC, a potential watershed for the monetary and financial systems of advanced economies.
Since at least the classic formulation of Bagehot in 1873, central banks have viewed their primary tasks as maintaining stable prices and ensuring financial stability through their role as lenders of last resort. With a CBDC, two additional and significant aspects come into play. First, a CBDC may become an attractive alternative to traditional demand deposits in private banks for all households and firms. Second, and as a result, the central bank may be transformed into a financial intermediary that needs to confront classic issues of banking, including maturity transformation and the exposure to a demand for liquidity induced by “spending” shocks (runs) of its private customers.

The authors examine the interplay of these new and traditional roles to evaluate the advantages and drawbacks of introducing a CBDC relative to the subsequent reorganization of the banking system and its consequences for monetary policy, allocations, and welfare. Building on, and then departing from, existing models which reveal that the optimal amount of risk-sharing among banks requires making them prone to bank runs, the authors ask whether central banks can avoid this problem.
In the authors’ model (and to briefly summarize here), classic bank runs may still occur due to a rationing problem, when liquidating illiquid real assets at a given price level. But since a central bank controls the price level and contracts are nominal, it can avoid rationing if it prefers. By issuing more currency, the monetary authority can always deliver on its obligation, but at the risk of inflation. Thus, their model illustrates how runs on a central bank can manifest themselves in two ways: either as a classic run, caused by the rationing of real assets, or as a run on the price level.
Now, imagine that a central bank has three goals: efficiency, financial stability (i.e., absence of runs), and price stability. The authors demonstrate an impossibility result that they term the CBDC trilemma: Of its three goals, the central bank can achieve at most two (see accompanying figure). For example: the authors demonstrate that the central bank can always implement the socially optimal allocation in dominant strategies and deter central bank runs at the price of threatening inflation off-equilibrium. If price-stability objectives for the central bank imply that the central bank would not follow through with that threat, then allocations either have to be suboptimal or prone to runs.
Bottom line: A central bank that wishes to simultaneously achieve a socially efficient solution, price stability, and financial stability (i.e., absence of runs) will see its desires frustrated. This work reveals that a central bank can only realize two of these three goals at a time.
-

US student loan debt reached $1.6 trillion in 2020, with calls for debt relief growing in strength as that number rises. However, not all debt forgiveness plans are created equal, and the impacts vary depending on the relative income of borrowers. For example, debt forgiveness can be universal, capped at a certain amount, or targeted to specific borrowers. Importantly, while much recent media and policy attention has focused on universal forgiveness, many may not realize that some student borrowers are already granted relief through an Income-Driven Repayment (IDR) plan, which links payments to income and which forgives remaining debt after, say, 20 or 25 years, depending on the plan. This means that low-income earners can receive substantial loan forgiveness over time.

To analyze policy options, the authors used the 2019 Survey of Consumer Finances (SFC) to estimate the present value of each student loan, and to forecast future payments and the evolution of a loan’s balance until it reaches zero or is forgiven. Regarding universal plans (forgiving all loans) or capped (forgiving loans to a certain amount), the authors find that these policies disproportionately accrue to high-income households. For example, individuals in the bottom half of the earnings distribution would receive 25% of the dollars forgiven. Households in the top 30% of the earnings distribution receive almost half of all dollars forgiven.
Next, the authors examined who would benefit from a more generous IDR plan that raised the threshold above which borrowers must pay a portion of their income, and which accelerated loan forgiveness. In contrast to universal forgiveness, expanding IDR leads to substantial forgiveness for the middle of the earnings distribution. Under a policy enrolling all borrowers who would benefit from IDR, individuals in the bottom half of the earnings distribution would receive two-thirds of dollars forgiven, and borrowers in the top 30% of the earnings distribution receive one-fifth of dollars in forgiveness. Raising the threshold above which borrowers pay a portion of their income and earlier loan forgiveness both lead to a large increase in forgiveness. However, under accelerating loan forgiveness, these benefits accrue to the top of the earnings distribution, while increasing the repayment threshold leads to large benefits for middle-income borrowers.
In sum, the authors find that universal and capped forgiveness policies are highly regressive, with the vast majority of benefits accruing to high-income individuals. On the other hand, IDR plans that link repayment to earnings lead to forgiveness for borrowers in the middle of the income distribution.
-
Since 1960, at least 115 foreign military occupations have ended, with a substantial percentage of these interventions involving a security transition from withdrawing troops to local allies, including a redeployment of weaponry. Despite these many transitions, little is known about the conflict dynamics of countries experiencing a foreign-to-local security transition.

This research offers new insights into these issues by conducting a microlevel study of the impact of the large-scale security transition that marked the end of Operation Enduring Freedom in Afghanistan—the long-running military campaign of the North American Treaty Organization (NATO). Planning for this transition to Afghan forces began as early as 2010 and was formally announced in 2011. The transition was staggered and coordinated around administrative districts. Over three years, and five transition tranches, Afghanistan’s districts were transferred to Afghan control.
The authors employed a unique dataset, including geotagged and time-stamped event data that documents dozens of different types of insurgent and security force operations, representing the most complete catalog of conflict activity during Operation Enduring Freedom currently available. They combined these observational data with microlevel survey data that included questions measuring perceptions of security conditions, the extent of local security provision, and perceptions of territorial control.
The authors find a significant, sharp, and timely decline of insurgent violence in the initial phase, the security transfer to Afghan forces, followed by a considerable surge in violence in the second phase, the actual physical withdrawal of foreign troops. Why does this happen? The authors argue that this pattern is consistent with a signaling model in which the insurgents reduce violence strategically to facilitate the foreign military withdrawal; after the troops are gone, the insurgents capitalize on their absence.
These findings clarify the destabilizing consequences of withdrawal in one of the costliest conflicts in modern history and yield potentially actionable insights for designing future security transitions.
-
One of the looming pandemic-related questions for the US economy is to what degree workers will remain working from home when the pandemic ends. By some estimates, roughly half of all work occurred at home, either in whole or in part, through October 2020. Crucial to this question is not only whether workers can work from home, but whether they should. Put another way, does worker productivity suffer when it occurs at home?

The authors surveyed 15,000 working-age Americans between May and October 2020 in waves, and the authors’ analysis of those responses reveals the following five reasons why working from home will likely stick:
- Reduced stigma. Most respondents report perceptions about working from home have improved among people they know.
- Employer learning. The pandemic forced workers and firms to experiment with working from home en masse, enabling them to learn how well it actually works.
- New investment. The average worker invested over 13 hours and about $660 dollars in equipment and infrastructure to facilitate working from home, amounting to 1.2% of GDP. In addition, firms made sizable investments in back-end information technologies and equipment to support working from home.
- Lingering fear. About 70% of respondents expressed a reluctance to return to some pre-pandemic activities, even when a vaccine is widely available, for example, riding subways and crowded elevators, or dining indoors at restaurants.
- New technologies. The rate of innovation around technologies that facilitate working from home has likely accelerated.

Network effects are likely to amplify the impact of these five mechanisms. For example, coordination among several firms will facilitate doing business while their employees are working from home. When several firms are operating partially from home, it lowers the cost for other firms and workers to do the same, creating a positive feedback loop.
For dense cities like New York and San Francisco, a pronounced shift to working from home will likely have a negative effect. The authors estimate that worker expenditures on meals, entertainment, and shopping in central business districts will fall by 5% to 10% of taxable sales.

Finally, many workers reported higher productivity while working from home during the pandemic than previously. Taking the survey responses at face value, accounting for employer plans about who gets to work from home, and aggregating, the authors estimate that worker productivity will be 2.4% higher post-pandemic due to working from home.
-
Are large banks good? On the one hand, size implies efficiencies of scale and an improvement in the delivery of financial services, which is good for the economy. On the other hand, size may encourage risky behavior and increase systemic risk if a big bank behaves badly and fails.
These are empirical questions, and Huber analyzes a rare period in postwar Germany when banking reforms determined when certain state-level banks were allowed to consolidate into national banks. Under these reforms, increases in bank size were exogenous to the performance of banks and their borrowers, which allowed Huber to estimate how changes in bank size causally affected firms in the real economy.

Huber digitized new microdata on German firms and their relationship banks to examine how the bank consolidations affected the growth of banks and their borrowers. His findings were clear: there was no evidence that increases in bank size raised the growth of borrowers. Firms and municipalities with higher exposure to the consolidating banks did not grow faster after their banks consolidated. Small, young, and low-collateral borrowers of the banks actually experienced lower employment growth after the consolidations. Further, the consolidating banks themselves did not increase lending, profits, or cost efficiency, relative to comparable other banks. The results show that increases in bank size do not always generate improvements in the performance of banks and their borrowers and might even harm some firms.
For policymakers, the impact of bigger banks remains a complex question that not only depends on whether a large bank operates efficiently, but on the net impact on other mechanisms, including the benefits and costs for borrowing firms. Huber’s analysis reveals that experience in postwar Germany highlights that the beneficial mechanisms are not always powerful enough to outweigh the harmful effects.
-
New private firms in China benefit heavily from investor relationships with state-owned firms or private owners that have equity ties to state owners. To document the importance of “connected” investors, the authors employed administrative registration data on the universe of Chinese firms from 2000 to 2019. These data provide information on the owner of every Chinese firm, which the authors used to identify firms with connected investors defined as state-owned firms, or private owners with equity ties to state-owned firms.

This ownership information reveals two key facts. First, there is a clear hierarchy of private owners in terms of the closeness of their equity links with state owners. In 2019, state owners had equity stakes in the firms of about 100 thousand private owners. These private owners are the largest in China and also hold equity in the companies of other, typically smaller, private owners. In turn, these private owners also invest in other, even smaller, private owners, and so on. At the very bottom of the hierarchy are owners that are up to forty steps away from the state owners at the top of the hierarchy and that do not invest in other owners. The very smallest private owners thus do not have any equity ties, direct or indirect, with state owners.
Second, the hierarchy of private owners with connected investors is a relatively recent phenomenon. In 2000, private owners with connected investors only accounted for about 16% of registered capital. By 2019, private owners with connected investors owned about 35% of all registered capital in China. The 19.5 percentage point increase in the share of connected private owners from 2000 to 2019 contributes a significant part of the increase in the share of all private owners over this period.
The growth of this hierarchy of connected owners is driven, in a proximate sense, by two related trends, broadly described here and in greater detail in the authors’ paper. First, in 2000, only 12% of state owners had joint ventures with private owners. By 2019, about a quarter of all state owners had such joint ventures. The result is that the number of private owners with joint ventures with state owners increased from about 20 thousand in 2000 to more than 100 thousand by 2019.
Second, private owners associated with the state also now undertake more investments with other private owners. For example, the 20 thousand private owners with joint ventures with state owners in 2000 themselves had joint ventures with less than 1.5 other private owners in that year. In 2019, the 100 thousand private owners directly connected with state owners were themselves the “connected investor” for 3.5 other private owners on average. The result is that the number of private owners invested by the directly connected private owners (i.e., two steps away from the state) increased from 23 thousand in 2000 to more than 300 thousand by 2019.
By 2019, the assets of connected private owners accounted for 35% of total assets in China, or about 45% of total assets of all private owners. At the same time, the share of connected state owners, the owners at the “top of the food chain” of the connected sector, was merely 21%, or 60% less than the share of connected private owners.
The authors estimate that the expansion of connected private owners may be responsible an average annual growth of 4.2% in aggregate output of the private sector between 2000 and 2019.
-
The COVID-19 pandemic has led to a surge in demand for medical care, and healthcare systems across the United States have faced the risk of being overwhelmed. This creates an opportunity to study the labor markets that hospitals use to manage temporary staffing shortages. How effective are short-term labor markets at re-allocating workers to where they’re needed most?
Using data from a healthcare staffing firm, the authors study flexibility of nurse supply across the United States. At different points throughout the spring and summer, hospitals in affected regions needed more nurses to deal with pandemic-related surges. The authors find that job postings for temporary nurse positions tripled from their usual rate at the height of the pandemic’s first wave, and increased even faster in places facing extreme pandemic conditions. In New York state, job postings increased eightfold, while the compensation almost doubled.

The differences across states and across nursing specialties allow the authors to study workers’ flexibility in this market. For example, there was little-to-no increase in wages for nurses working in labor and delivery units, as the first wave of the pandemic did not change the number of women who were already pregnant.In contrast, demand skyrocketed for for nurses in intensive care units (ICU) and emergency rooms (ER). For these specialties, the number of job openings and compensation rates are positively associated with state-level COVID-19 case counts. In other words, more acutely ill COVID-19 patients implies increased need for traveling nurses, and higher payments required to recruit them. Based on one estimate, ICU jobs increased by 239 percent during the first wave of the pandemic, while compensation increased 50 percent. ER jobs increased by 89 percent while compensation increased by 27 percent.
The large size of the United States, and nurses’ ability to work in different states, appears to be an important part of how this market adapted to the first waves of demand for COVID-19 nursing. An analysis by the authors demonstrates that the increases in quantity may understate the willingness of ICU and ER nurses to travel, given relatively higher compensation. In economic terms, they find nursing supply to be highly elastic, which suggests that price signals are an effective way of reallocating nurses to the parts of the country with increased staffing needs. Likewise, they find that workers who accept such postings travel longer distances from their homes to job locations when pay is higher.
This work suggests that a national staffing market may offer timely flexibility to accommodate demand shocks. When demand increases in specific geographic areas, nurses’ ability to move can help mitigate a local shortage. That said, adjusting to a simultaneous national demand shock is harder. If numerous different regions experience simultaneous COVID-19 surges, meeting demand may require more than mobility across regions. Even though some nurses can travel, there is still a limited national supply of those with skills in demand.
-
Stock markets cratered after mid-February 2020 in countries around the world, as the coronavirus pandemic spread beyond China. In what many see as a puzzle, the global stock market recovered more than half its losses from March 23 to late May. US stock market behavior, in particular, has prompted much head scratching: Despite a failure to control the pandemic, the US stock market recovered 73% of its lost value by the end of May and 95% by July 22.
The authors show that stock prices and workplace mobility (a proxy for economic activity) trace out striking clockwise paths in daily data from mid-February to late May 2020. Global stock prices fell 30% from February 17 to March 12, before mobility declined. Over the next 11 days, stocks fell another 10 percentage points as mobility dropped 40%. From March 23 to April 9, stocks recovered half their losses and mobility fell further. From April 9 to late May, both stocks and mobility rose modestly. The same dynamic played out across the vast majority of the 31 countries in the authors’ sample.

A second finding reveals that stock prices were lower when countries imposed more stringent market lockdown measures: national stock prices are 3 percentage points lower when the own-country lockdown stringency index is one standard deviation higher, and 4.7 points lower when the global average stringency index is one standard deviation higher. These are separate effects, and both are highly statistically significant.
The authors also closely analyzed stock prices in the world’s two largest economies—China and the US. They find that the COVID-19 pandemic had much larger effects on stock prices and return volatilities in the US than in China. At least in part, the larger impact on American stock prices reflects China’s greater success in containing the pandemic. However, the authors stress that the US stock market shows a much greater sensitivity to pandemic-related developments long before it became evident that its early containment efforts would flounder.
-
To reduce the risk of exposure to the COVID-19 virus, roughly one-third of the American labor force has been working from home. Household expenditures have also changed dramatically, reflecting both the loss of income and consumption opportunities, and a shift toward household production. Additional time and consumption at home requires significant increases in electricity consumption. This represents an additional and essential expense at a time that many households are also experiencing severe economic hardship.

Using data that provides hourly residential electricity consumption in Texas, along with another dataset that reports monthly consumption of electricity by customer class (residential, commercial, and industrial) for most U.S. utilities, the author found that the increase in residential consumption corresponds with those workers able to work from home. Also, while rising unemployment is strongly associated with commercial and industrial electricity declines, it is weakly associated with residential increases. Non-essential business closures do not have statistically significant impacts on usage beyond the direct potential employment effects.
Further, the author finds that the increase in residential consumption is not common in economic downturns; for example, it did not occur during the Great Recession. From April to July 2020, American households spent nearly $6 billion in excess residential electricity consumption. Electricity bills were over $20/month higher on average for utilities serving one-fifth of US households. This increased expenditure reduces the net benefits of working from home associated with less commuting and improved environmental quality. As industrial and commercial activity recovers, working from home has the potential to increase emissions from the power sector on net. In the same way that dense cities are more energy efficient than suburbs, it requires more energy to heat and cool entire homes than the offices and schools.
-
The COVID-19 pandemic triggered a shift to working-from-home (WFH) that has already saved billions of hours of commuting time in the United States alone. The authors tap several sources, including original surveys of their own design, to quantify this time-saving effect and to develop evidence on how Americans are using the time savings.
Over the course of May, July, and August 2020, the authors surveyed 10,000 Americans aged 20-64 who earned at least $20,000 in 2019: 37.1% worked from home, 34.7% worked on business premises, and the rest were not working. These figures imply that WFH accounts for 52.3% of employment in the pandemic economy, which is similar to other estimates. By way of comparison, American Time Use Survey data imply a 5.2% WFH rate among employed persons before the pandemic.
To calculate aggregate time savings from increased WFH, the authors gathered data from two national surveys to determine the number of commuting workers and average commuting times. They find that commuting time dropped by 62.4 million hours per day. Cumulating these daily savings from mid-March to mid-September, the authors find that aggregate time savings is more than 9 billion hours.
The accompanying figure illustrates that people spent over one-third of their extra time on their primary job, and nearly one-third on childcare, outdoor leisure and a second job, combined.

-

As the travel industry experiences a pandemic-induced slump, many are wondering about the future of air travel and how long it will take until people are comfortable enough to fly for work or leisure.
According to the recent Survey of Business Uncertainty[1], conducted July 13-24, the authors find that firms anticipate slashing their post-pandemic travel budgets and tripling the share of external meetings (those with external clients, patients, suppliers, and customers) conducted virtually.
The authors’ findings cast doubt on the prospect for a quick and complete rebound in business travel. Firms anticipate slashing their pre-pandemic travel expenditures by nearly 30 percent when concerns over the virus subside (see Figure 1). The expected decline in travel expenditures is particularly severe for information, finance, insurance, and professional and business services, which are marking in a nearly 40 percent reduction in travel spending after the pandemic ends.
Such a large, broad-based reduction in travel spending not only suggests a sluggish and potentially drawn-out recovery for the travel, accommodation, and transportation industries, but it also indicates that firms expect to shift from face-to-face meetings to lower-cost virtual meetings. And, as Figure 2 shows, that’s exactly what the authors found when they asked firms about the share of virtual meetings that they held in 2019 versus the share that they anticipate holding in a post-COVID world.
[1] The SBU is a monthly panel survey developed and fielded by the Federal Reserve Bank of Atlanta in cooperation with Chicago Booth and Stanford.

-
The authors provide evidence that COVID-19 shifted the direction of innovation toward new technologies that support video conferencing, telecommuting, remote interactivity, and working from home (collectively, WFH).
By parsing automated readings of the subject matter content of US patent applications, the authors find clear evidence that patents for WFH technologies are advancing at an accelerated rate. The accompanying figure reports the percentage of newly filed patent applications that support WFH technologies at a monthly frequency from January 2010 through May 2020. Interestingly, the WFH share of new patent applications rises from 0.53% in January 2020 to 0.77% in February, before the World Health Organization declared the novel coronavirus outbreak a global pandemic. China reported the first death from COVID-19 in early January and imposed a lockdown in Wuhan on January 23, 2020. By the end of January, the virus had spread to many other countries, including the United States. This figure suggests that these developments had already—by February—triggered the beginnings of a shift in new patent applications toward technologies that support WFH.
By March, COVID-19 cases and deaths had exploded in many localities and countries around the world. As the figure illustrates, the WFH percentage of new patent applications from March to May are nearly twice as large as the January value, providing clear evidence for the authors that COVID-19 has shifted the direction of innovation toward technologies that support WFH.

-

The authors use individual and household-level micro data to document that those workers who have particularly low earnings, low wealth and low buffers of liquid assets are the ones employed in social-intensive occupations where they must show up for work. On the other hand, workers in flexible occupations with low social exposure tend to have higher earnings, robust balance sheets, and enough liquid wealth to weather the storm.
This strong positive correlation between economic exposure to the pandemic and financial vulnerability suggests that the effects of the pandemic have been extremely unequal across the population. This means that there are a range of economic and health policy options, with appropriate patterns of redistribution, that can be used to contain the virus and mitigate its economic effects.
The accompanying charts illustrate this phenomenon, and include the following occupational distinctions:
- Essential: Jobs that are needed for the economy to function and cannot be performed remotely, like nurses, firefighters, or mail carriers.
- Low social intensive/high flexibility: Remote jobs where products do not require high social density, like writers, software developers, and accountants.
- Low social intensive/low flexibility: Jobs that mostly require on-site presence but still allow for social distancing, like carpenters, electricians, and plumbers.
- High social intensive/high flexibility: Jobs that are best performed when workers are in contact with customers or other workers, but which can also be done remotely, like teachers and therapists.
- High social intensive/low flexibility: Jobs where workers need to need to be in close contact with customers or other workers, on-site, like cooks, waiters, and many performance artists.
Chart 1 reports the average earnings and employment shares of each of the five occupations; average annual earnings are highest for those with high flexibility to work remotely and low social interaction ($79,000), and lowest for those with low flexibility and high social interaction ($32,000). Chart 2 reveals that workers in rigid and essential occupations are significantly more financially vulnerable than those in flexible occupations.

-
How has government stimulus affected economic welfare? The Coronavirus Aid, Relief, and Economic Security (CARES) Act is a $2.2 trillion economic stimulus bill enacted in the spring of 2020 to support American families, workers and businesses. The authors find that programs under the CARES Act succeeded in mitigating economic welfare losses by around 20% on average, while leaving the cumulative death count effectively unchanged.
The model focused on the four most important components of the CARES Act for household welfare:
- Economic Impact Payments (EIP);
- Expanded Unemployment Insurance (UI);
- The Paycheck Protection Program (PPP); and
- Waiving of tax penalties for retirement account withdrawals.
Figure 1 presents a range of policy options that can be quantitatively compared. The mean with fiscal support from the CARES Act shifts the Pandemic Possibility Frontier forward in the United States, allowing for the same number of fatalities with lower economic costs. In comparison, with the laissez-faire approach, fatalities are highest and the average economic costs of the pandemic are around two months of income because individuals react to rising infections by reducing both social consumption and supply of workplace hours.

The impact of the stimulus package on economic aggregates is substantial. Both the transfer programs (EIP, UI) and PPP boost aggregate consumption by around 6 percentage points, with about 4 points coming from PPP and the remainder from UI and EIP.
However, the stimulus package made the economic consequences of the pandemic more unequal. The stimulus package redistributed heavily toward low-income households, while middle-income households gained little from the stimulus package but will face a higher future tax burden.

In the model, labor incomes fall most for the lowest quartile of the pre-pandemic income distribution and remain persistently low. The drop in labor earnings for workers at the bottom of the income distribution was at least 10 percentage points deeper than those at the top of the income distribution.
Oddly, while labor incomes have fallen more for poor households than for rich ones, and have remained persistently low, consumption expenditures of the poor initially fell by the most but then recovered more quickly than those of the rich. Many households at the bottom of the income distribution with liquidity constraints actually experienced large increases in their total incomes. For many in the bottom distribution, UI benefits exceeded their incomes (with replacement rates over 100%), and recipients of stimulus checks living hand-to-mouth spent their benefits in the first weeks after receipt. As a result, households with lower earnings, greater income drops, and lower levels of liquidity displayed stronger spending responses.
A consequence of the CARES Act is a large increase in government debt. The model shows that after eighteen months, the debt-to-GDP ratio increases by about 12% above its pre-pandemic level, compared with an increase of 3% without the stimulus package.
-

The debate about how to manage the health and economic effects of the COVID-19 pandemic revolves around varying degrees of lockdown vs. no lockdown at all. However, in their recent paper that describes the distributional effects of existing policies, Greg Kaplan, Benjamin Moll, and Giovanni Violante offer a novel alternative. Instead of shutting down businesses or allowing partial openings to prevent people from gathering and spreading the disease, why not tax people’s behavior instead?
In economic parlance, taxes that are meant to drive behavior to achieve a certain goal are known as Pigouvian taxes, after the English economist A.C. Pigou (1877-1959). An example is a factory that emits lots of air pollution, called a negative externality, which creates problems downwind at little extra cost to the factory. One way to get the factory to scrub its emissions is to tax it relative to the social costs that it is imposing.
Such taxes are also enacted to modify the negative externalities of personal behavior, like drinking alcohol and smoking cigarettes. And it is with personal behavior that the authors apply the idea of Pigouvian taxes to the question of how best to limit the negative health and economic effects of COVID-19. Put directly: If you want to restrict the number of people that gather in a bar to have a drink, then you could tax that drink at such a level that you will attain adequate social distancing without closing the bar. Too many people want to attend a baseball game? Price the tickets to optimize attendance. The same holds true for work. Do people feel the need to attend their workplace even if their job does not require their presence on-site? Then make them pay a tax approximate to the cost that they are inflicting on society. Such a tax will keep most workers at home.
However, either one of these taxes is particularly bad for a subset of individuals – in the case of a tax on social consumption, those working in the social sector, and in the case of a tax on on-site work, those in rigid occupations who must show up for work. These costs can be partially mitigated by using the revenues from the tax to provide lump-sum subsidies to precisely those workers that are most adversely affected.
This is a simple description of the authors’ more detailed analysis, which employs their distributional pandemic possibility frontier (PPF) analysis, a technique that describes the heterogeneous effects of policies. In the accompanying figures, this dispersion of effects is shown by the colored bands that extend around the bold lines. Figure 1 (orange line) traces the PPF for a 30% tax on social consumption that is kept in place for different durations. Deaths due to COVID-19 are plotted on the horizontal (x) axis, and economic cost, as measured in multiples of monthly income, is on the vertical (y) axis. As we can see, the longer a policy is kept in place, the greater is the dispersion in welfare cost.
Alternatively, policymakers could impose a tax on hours worked in the workplace and then rebate the proceeds to workers in occupations that demand their appearance. This tax targets the labor supply margin as the source of the negative externality, as opposed to the social consumption margin. The green line in Figure 1 traces the PPF for a 30% tax on workplace hours with different durations. This policy generates a flatter PPF than a social consumption tax. With a tax on workplace hours in place for 2 months, the mean economic welfare loss is about 2 times monthly income, which is about the same as in the laissez faire scenario, but with a substantially smaller number of deaths, by around 0.1% of the population.
The authors do not claim that such alternative policies would be politically expedient to implement, and they detail limitations and challenges in their paper. However, they stress the lesson that targeted policies do exist that offer a more favorable average trade-off between lives and livelihoods than blunt lockdowns.
-
These numbers suggest, among other things, that male football and basketball athletes subsidize other activities and other athletes. The data also raise questions about whether athletes could—or should—retain a higher percentage of their sports’ earnings. To investigate these and other questions, the authors collected comprehensive data covering revenue and expenses for FBS schools between 2006 and 2019, and assembled new data using complete rosters of students matched to neighborhood socioeconomic characteristics.

Among their findings, the authors estimate that rent-sharing leads to increased spending on women’s sports and other men’s sports as well as increased spending on facilities, coaches’ salaries, and other athletic department personnel. This transfer also occurs on a player level, that is, a subset of athletes are subsidizing others. Given the demographics of men’s football and basketball and those of other sports, the authors find that the existing limits on player compensation effectively transfers resources away from students who are more likely to be black and who come from poor neighborhoods toward students who are more likely to be white and come from higher-income neighborhoods.
Regarding compensation, the authors calculated a potential wage structure for football and men’s basketball players based on collective bargaining agreements in professional sports leagues, where athletes generally retain about 50 percent of earnings. They estimate that if FBS football and men’s basketball players split 50 percent of revenue equally, each football player would receive $360,000 per year and each basketball player would earn nearly $500,000 per year. If athletes were paid relative to how various positions are compensated, the two highest paid football positions (starting quarterback and wide receiver) would be paid $2.4 million and $1.3 million, respectively. Similarly, starting basketball players would earn between $800,000 and $1.2 million per year.
The authors have made the data in their paper publicly available online at here, for the benefit of future research.
-

Sixty-eight percent of workers who lost their jobs due to the COVID pandemic received benefits that exceeded their previous wages,¹ raising the question of whether those workers would decline offers to retake their old jobs at the prior wage.
To investigate this important policy question, the authors devised a model that approximates the environment faced by unemployed workers, including the short duration of the extra benefits, the likelihood their offer to take back their old job stays valid, the likelihood they will find another job if they turn down their previous employer’s offer, and related issues. They check their model’s results against available data. Except in special cases, the authors find that unemployed workers would accept the offer to return to their old jobs at their old wage.
The authors first consider what workers would do if they made an incorrect, static, decision: Keep the higher benefits or return to work at a lower wage. In such a case, 68% of workers would choose the higher benefits under the CARES Act. However, when workers weigh up these dynamic issues—like whether the benefits would end, whether the job offer was limited in time, and whether other jobs are available—most workers would accept the job offer and return to work. Only a worker with a low previous wage and an almost certain return-to-work offer would turn down their old job and remain unemployed under the CARES Act.
According to this analysis, the CARES Act did not cause high unemployment in April to July 2020 by decreasing labor supply. While the precise cause is beyond the scope of this research, the authors do note the likelihood of low labor demand, and/or low labor supply due to health risks.
1 See Ganong, P., P. Noel and J.S. Vavra (2020): “US Unemployment Insurance Replacement Rates During the Pandemic,” BFI Working paper and BFI COVID-19 Fact.
-

Signed into law on March 27, 2020, the CARES Act was exceptional both in size (over $2 trillion in allocated funds) and in the speed at which it was legislated and implemented. A major component was a one-time transfer to all qualifying adults of up to $1200, with $500 per additional child. How effective were these transfers in stimulating the consumption of recipients?
Using a large-scale survey of US households, the authors document that only 15% of recipients of this transfer say that they spent (or planned to spend) most of their transfer payment, with the large majority of respondents saying instead that they either mostly saved it (33%) or used it to pay down debt (52%). When asked to provide a quantitative breakdown of how they used their checks, US households report having spent approximately 40% of their checks on average, with about 30% of the average check saved and the remaining 30% used to pay down debt. Little of the spending went to hard-hit industries selling large durable goods (cars, appliances, etc.). Instead, most of the spending went to food, beauty, and other non-durable consumer products that had already seen large spikes in spending because of hoarding.
These average responses mask significant differences across households. For example, lower-income households were significantly more likely to spend their stimulus checks, as were households facing liquidity constraints. Individuals out of the labor force were also more likely to spend their checks than either employed or unemployed individuals, consistent with motives of consumption smoothing and hand-to-mouth behavior.
Other groups that were more likely to report spending most of their checks were those living in larger households, men, Hispanics and those with lower education. In contrast, African-Americans were much more likely to report using their checks primarily to pay off debt, as were older individuals, those with mortgages, unemployed workers and those reporting to have lost earnings due to COVID. For those who did not wish to spend their stimulus payment and had to decide whether to pay off debt or save their checks, higher-income individuals were more likely to save than pay off debts, those with mortgages or renters were much more likely to pay off debts, as were financially constrained individuals.
Finally, and importantly, 90% of employed workers who received a stimulus check reported that the transfer had no effect on their work effort (as opposed to, e.g., searching harder for new work) while 80% of those employed workers who did not qualify for a check reported that receiving such a check would not affect their work effort; the same holds for people out of the labor force. For unemployed workers, approximately 20% of those receiving a payment said that this made them search harder for a job, while two-thirds report that it had no effect.
These results suggest that additional payments to households during the height of the pandemic—either in the form of stimulus checks or additional UI benefits—are unlikely to negatively affect the recovery because of disincentives to work.
-

Political polarization and competing narratives can undermine public policy implementation. Partisanship may play a particularly important role in shaping heterogeneous responses to collective risk during periods of crisis when political agents manipulate signals received by the public (i.e., alternative facts). We study these dynamics in the United States, focusing on how partisanship has influenced the use of face masks to stem the spread of COVID-19.
Using a wealth of micro-level data, machine learning approaches, and a novel quasi-experimental design, we document four facts: (1) mask use is robustly correlated with partisanship; (2) the impact of partisanship on mask use is not offset by local policy interventions; (3) partisanship is the single most important predictor of local mask use, not COVID severity or local policies; (4) Trump’s unexpected mask use at Walter Reed on July 11, 2020, significantly increased social media engagement with, and positive sentiment toward, mask-related topics. These results unmask how partisanship undermines effective public responses to collective risk and how messaging by political agents can increase public engagement with mask use.
-
This research offers insights into the impact of the 2005 Bankruptcy Abuse Prevention and Consumer Protection Act (BAPCPA), which are especially as policymakers discuss bankruptcy reform proposals.

The authors find that bankruptcy filings fell by roughly 50 percent after BAPCPA, with about one million fewer bankruptcy filings in the two years after the law was passed. Reduced filings meant lower costs for credit card companies and, likewise, lower interest rates for credit card customers. The authors find that a one-percentage-point decline in bankruptcy-filing risk within a credit-score segment decreases average interest rates by 70–90 basis points.
The authors also addressed the important issue of who was prevented from filing bankruptcy because of BAPCPA when, indeed, they could have benefited from the relief; in this case, the adverse shock experienced by consumers when confronted with hospitalization. The results were stark. They find that an uninsured hospitalization increases the likelihood of filing for bankruptcy by 1.5 percentage points prior to BAPCPA, but by just 0.4 percentage points after the reform. Put another way, the authors find that uninsured hospitalizations result in a similar amount of debt sent to collections under both bankruptcy regimes, but 70 percent fewer bankruptcy filings after the reform. This reduction is persistent over time.

This final finding represents a key contribution of this research. Hospitalization is just one example of an adverse shock, but to the extent that this finding generalizes to other types of financial setbacks, these results provide suggestive evidence that the bankruptcies deterred by BAPCPA were not limited to the most “abusive” filings. Instead, these results imply that BAPCPA may have meaningfully reduced the insurance value of bankruptcy.
-

About one in five US workers received unemployment insurance benefits in June 2020, which is five times greater than the highest UI recipiency rate previously recorded. Yet little is known about how unemployment benefits are affecting the economy today. To fill this gap, the authors study the consumption of benefit recipients during the pandemic using data from the JPMorgan Chase Institute.In normal times, spending among unemployment benefit recipients falls by about seven percent when they become unemployed because typical benefits replace only a fraction of lost earnings. However, the CARES Act added a $600 weekly supplement to state unemployment benefits, replacing more than 100 percent of lost earnings for two-thirds of unemployed workers. As a result, the authors find very different spending patterns for unemployed households during the pandemic.
Although average spending fell for all households as the economy shut down at the start of the pandemic, the authors find that unemployed households actually increased their spending beyond pre-unemployment levels once they began receiving benefits. The fact that spending by benefit recipients rose during the pandemic instead of falling, like in normal times, suggests that the $600 supplement has helped households to smooth consumption and thus propped-up aggregate demand.
The authors also examine spending patterns of the unemployed while waiting for benefits to arrive. Households that receive benefits soon after job loss show no relative decline in spending, while households that wait two months to receive benefits due to processing delays have large spending declines. Compared to the employed, spending falls by 20 percent prior to receiving benefits. This suggests that delays have imposed substantial hardship on benefit recipients.

-
This research offers insights into the evolving reactions of Americans to the COVID-19 pandemic along political lines, including their reactions to mask-wearing and the likelihood of further lockdowns. The project consists of seven survey waves beginning in April 2020 and ending in November 2020. These three select findings are compiled from the first five waves, conducted from April 6 to May 18.[1]
1. A loss of income due to the pandemic led many to admit that COVID-19 crisis is worse than they expected, with this effect mitigated by the choice of news source.
In the first wave of the survey, commencing April 6, 35% of Republicans said the media were exaggerating the virus’ threat, compared to only 9% of Democrats. In the fourth wave beginning April 27, 57% of Republicans said the pandemic was worse than they expected, compared with 82% of Democrats. Importantly, as illustrated in the accompanying figure, respondents who lost income were more likely to report that COVID-19 was worse than anticipated: 62% vs. 48% for Republicans, and 84% vs. 75% for Democrats. Regarding media influence, among Republicans, 44% of those who watched Fox News were significantly less likely to report that the virus was worse than expected, compared with 56% of those Republicans who did not watch Fox News. Similarly, among Republicans, those who did not support Trump were 50% more likely to report that the crisis was worse than expected than those expected to vote for Trump.

2. An important factor influencing support for mask wearing is trust in the scientific community. This has decreased significantly among Republicans since the start of the pandemic.
Between the beginning and end of April 2020 (waves one through four), Democrats’ confidence in the scientific community was mostly unchanged, 70% vs. 68%. For Republicans, those numbers fell from 51% to 38%.
3. Political views and perception of the gravity of the crisis also influenced the likelihood of anticipating a second lockdown.
At the end of April, about 30% of Republicans said that the government should fully reopen the economy in May, compared to about 5% of Democrats. In Mid-May, the authors asked 398 Democrats and Republicans whether they thought their state would need to reintroduce lockdown measures before the end of the year; 43% of Republicans said that such a lockdown was likely vs. 76% of Democrats.
Finally, while the authors do not hazard predictions, they stress that their research reveals the influence of dramatic events in changing or reinforcing people’s views and preferences, even if those events occur over a short period. Their next survey, slated for October, will likely provide key insights leading into the election.

Footnote:
[1] Researchers at the Poverty Lab and the Rustandy Center for Social Sector Innovation at the University of Chicago are conducting this longitudinal survey in partnership with NORC at the University of Chicago, an independent, non-partisan research institution. The findings refer to different time frames according to the questions analyzed. Surveys are administered to the same sample of more than 1,400 Americans based on NORC’s probability-based AmeriSpeak Panel, which is designed to be representative of the U.S. population. -

While active funds as a whole experience outflows during the crisis, funds that apply exclusion criteria in their investment process receive net inflows. Funds with higher sustainability ratings from Morningstar also receive larger flows, driven especially by environmental concerns. The pre-crisis trend of flows toward sustainability-oriented funds thus continues during the COVID-19 crisis. The fact that investors retain their commitment to sustainability during a major crisis suggests they have come to view sustainability as a necessity rather than a luxury good.
-

Despite rich investment opportunities presented by market dislocations, most US active equity mutual funds underperform passive benchmarks between February 20 and April 30, 2020. The average fund underperforms the S&P 500 index by 5.6% during the ten-week period (29% annualized). The average underperformance relative to the style benchmark is 2.1% (11% annualized). Eighty percent of funds have negative CAPM alphas, and average fund alphas computed relative to five different factor models are all negative. These results undermine the popular hypothesis that active funds make up for their disappointing unconditional performance by performing well in recessions.
-
COVID-19 Keeping Some Older Workers Home … Permanently

The arrival of COVID-19 resulted in dramatic changes in the US labor markets with initial claims skyrocketing and a sharp decline in labor-force participation of more than 7 percentage points. Less noticed was the key driver of the drop in labor-force participation: a wave of earlier than planned retirements. The authors use customized surveys on a panel of more than 10,000 Americans before, and at the onset of, COVID-19 to show that the share of Americans not actively looking for work because of retirement increased by 7 percentage points between January and early April of 2020.
This increase is more than twice as large among women as among men. This makes early retirement a major force in accounting for the decline in the labor-force participation. Given that the age distribution of the two surveys is comparable, this suggests that the onset of the COVID-19 crisis led to a wave of earlier than planned retirements. With the high sensitivity of seniors to the COVID-19 virus, this may reflect in part a decision to either leave employment earlier than planned due to higher risks of working or a choice to not look for new employment and retire after losing their work in the crisis.
To better understand which parts of the age distribution might drive the increase of retirees in their survey and whether economic incentives at least partially play a role, the authors plot in the accompanying figure the fraction of those claiming being retired (left scale) both in the pre-crisis wave (yellow line) and in the crisis wave (red) together with the difference between the two (blue line, right scale). The crisis has shifted the whole distribution up, that is, for each part of the age distribution a larger fraction of the survey population now claims being retired. Hence, even for those that are well before retirement age, the authors note a large increase in early retirement. Moreover, a notable jump in the difference occurs at age 66, which is the first year people can claim retirement benefits without penalty from the social security administration (SSA). Historically, only a few people returned from retirement to the labor force, which hints toward a sluggish recovery down the road.
-
Paycheck Protection Program Exposure (PPPE) and Post-PPP Outcomes
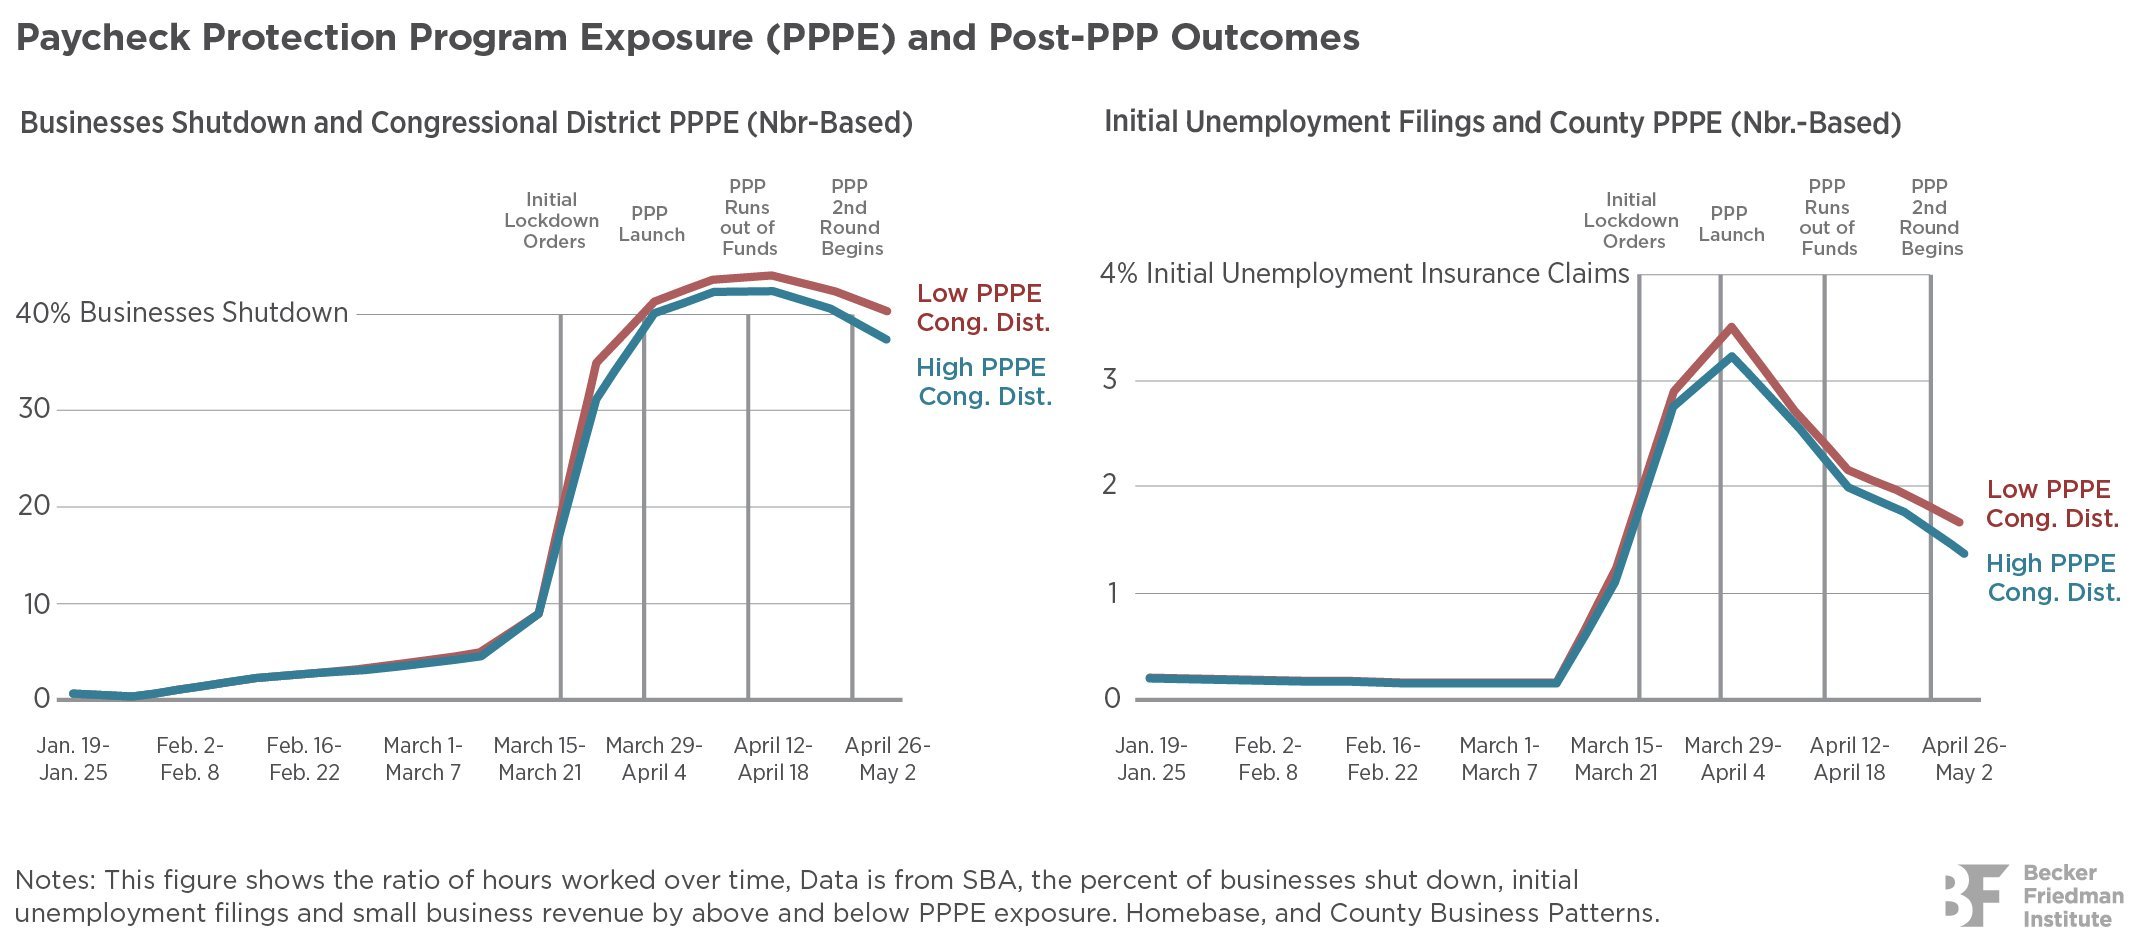
This work builds on the authors’ late-April research (The Targeting of the Paycheck Protection Program) that did not find evidence that PPP funds flowed to areas that were more adversely affected by the economic effects of the pandemic, and that lender heterogeneity in PPP participation explains, in part, the weak correlation between economic declines and PPP lending.
In this work, the authors present two new findings:
- They reveal no evidence that the PPP had a substantial effect on local economic outcomes during the first round of the program. The authors examined weekly firm-level employment and shutdown data, and they confirmed this evidence using initial unemployment insurance claims at the county level. The absence of a significant effect on UI claims during the initial weeks of the program is striking, especially given that one motivation for the PPP was to provide “relief” for congested state unemployment insurance systems. If the significant funds disbursed by PPP had little effect on unemployment, then what did firms do with the extra cash? The answer follows:
- The authors draw on Census Small Business Survey data to reveal that firms used PPP funds to increase liquidity, to make loan payments, and to meet other financial obligations. For these firms, the PPP may have strengthened balance sheets at a time when shelter-in-place orders prevented workers from working, and when unemployment insurance was more generous than wages for a large share of workers. Importantly, this suggests that while employment effects are small in the short run, they may well be positive in the medium run because firms are less likely to close permanently. Finally, many less affected firms received PPP funding and may have continued as they would have in the absence of the funds, either by spending less out of retained earnings or by borrowing less from other sources.
For policymakers charged with crafting effective policies that meet desired goals, measuring the social insurance value of the PPP is essential. As data become available, the authors will continue to examine the program’s effects on firms’ ability to meet commitments, as well as other medium- and long-term effects.

-
The list of uncertainties surrounding the COVID-19 pandemic is long, beginning with health-related issues and extending to the economy, including infection rates, vaccine development, possible new infection waves, near-term policy effects, economic recovery rates, government interventions, shifts in consumer spending, and many other issues.
To get their hands around the nature and scope of economic uncertainty before and during the pandemic, the authors examined a number of measures that focus on forward-looking uncertainty measures. Those measures are illustrated in the figures below; broadly speaking, they reveal huge—and varying—uncertainty jumps, including an 80 percent rise (relative to January 2020) in two-year implied volatility on the S&P 500, to a 20-fold rise in forecaster disagreement about UK growth. Also, time paths differ: Implied volatility rose rapidly from late February, peaked in mid-March, and fell back by late March as stock prices began to recover. In contrast, broader measures of uncertainty peaked later and then plateaued, as job losses mounted, highlighting the difference in uncertainty measures between Wall Street and Main Street.
While cautious about predictions, the authors do suggest that such high levels of uncertainty are not conducive to a rapid economic recovery. Elevated uncertainty generally makes firms and consumers cautious, retarding investment, hiring, and expenditures on consumer durables. Given the scale of recent job losses and the collapse in investment, a strong, rapid recovery would require a huge surge in new activity, which unprecedented levels of uncertainty will discourage.


-
The Labor Market Collapse

The COVID-19 pandemic hit the US labor market with astonishing speed. For the week ending March 14, 2020, there were 250,000 initial unemployment insurance claims—about 20% more than the prior week, but still below January levels. Two weeks later, there were over 6 million claims, shattering the pre-2020 record of 1.07 million, set in January 1982. As of mid-June, claims remained above one million for 13 consecutive weeks, with a cumulative total of over 40 million. At the same time, the unemployment rate spiked from 3.5% in February to 14.7 percent in April, and the number of people at work fell by 25 million.
Given the rapid nature of these extensive job losses, and the inability of existing labor market information systems to keep up with such changes, the authors devised a measurement method that combines data from traditional government surveys with non-traditional data sources, particularly daily work records compiled by Homebase, a private sector firm that provides time clocks and scheduling software to mostly small businesses. The authors linked this data with a survey answered by a subsample of Homebase employees, as well as other data sources to measure the effects of shelter-in-place orders and other policies on employment patterns from March to early June.
The unemployment rate (not seasonally adjusted) spiked by 10.6 percentage points between February and April, reaching 14.4%, while the employment rate fell by over 9 percentage points over the same period. These two-month changes were roughly 50% larger than the cumulative changes in the respective series in the Great Recession, which took over two years to unfold. Both unemployment and employment recovered a small amount in May, but remain in unprecedented territory.
The authors’ novel methodology delivers insights beyond official statistics. For example, Panel B of the accompanying Figure reveals that total hours worked at Homebase firms fell by approximately 60% between the beginning and end of March, with the bulk of this decline in the second and third weeks of the month—facts that go unrevealed in government data. The largest single daily drop was on March 17, when hours, expressed as a percentage of baseline, fell by 12.9 percentage points from the previous day. The nadir seems to have been around the second week of April. Hours have grown slowly and steadily since then.
-
The CARES Act, signed into law on March 27 to combat the economic fallout from the COVID-19 pandemic, is the largest economic stimulus in US history. Among its many provisions, CARES also contained several corporate tax breaks. Ostensibly, these tax breaks provided immediate liquidity and incentives for firms to avoid layoffs. However, the tax breaks have received a lot of criticism, with some calling them a “giveaway” to large corporations, and several Democratic politicians have introduced measures to scale them back.

An analysis of SEC filings—in which publicly-traded US firms are required to discuss material events—since the passage of CARES reveals the following:
- Most firms (61%) do not discuss the CARES tax provisions in their filings, suggesting the tax provisions did not materially impact most publicly-traded US firms.
- The most commonly discussed tax provision was the NOL carryback rule, which allows firms to recoup prior taxes paid. While this provision can provide immediate liquidity, it only applies to firms that were unprofitable in the years immediately prior to the pandemic. The other tax provisions were discussed by fewer than 15% of firms.
- The firms that were most likely to discuss the NOL carryback provision were those with pre-pandemic losses and large stock price declines during the pandemic, rather than those operating in states or sectors with large increases in unemployment.
- In contrast, the payroll tax deferral, which was designed to provide liquidity to a broad sample of firms, was more likely to be discussed by firms with more employees and lower cash holdings. And the employee retention credit, intended to encourage firms to keep employees on payroll while they were not working, was more likely to be discussed by firms operating in industries and states with larger unemployment changes. Thus, these two tax provisions appear more likely to benefit firms hardest hit by the pandemic.
- Certain firms (including those that eroded their liquidity with large shareholder payouts and engaged in substantial lobbying during the CARES Act debate) may have avoided discussing these tax breaks in their SEC filings for fear of negative public attention.
The authors acknowledge that firms may benefit from the provisions without discussing them in their SEC filings, and thus the full picture as to how these tax breaks affected U.S. firms will not be clear for some time. However, these early findings cast some doubt on the idea that the CARES corporate tax provisions provided significant liquidity and incentives to retain employees for most publicly-traded U.S. firms. Furthermore, the most frequently discussed tax provision—the NOL carryback—may have primarily benefitted the firms (and their shareholders) whose stock price had deteriorated the most prior to CARES, rather than the firms operating in areas hardest hit by the pandemic.

-

Using data from ADP¹ one of the world’s largest human resources management companies, to measure changes in the US labor market during the early stages of this “Pandemic Recession,” the authors find that paid US employment declined by about 21% between mid-February and late-April, 2020. Given that US private employment in February was 128 million workers (on a non-seasonally adjusted basis), the ADP data suggest that total paid employment in the US fell by about 26.5 million through late April. As of late May, paid employment is still about 19.5 million jobs below its mid-February levels.
The authors reveal that employment declines were disproportionately concentrated among lower-wage workers: 30% of all workers in the bottom quintile of the wage distribution lost their job, at least temporarily, through May. The comparable number for workers in the top quintile was only 5%. Finally, the authors reveal that businesses have cut nominal wages for about 10 percent of continuing employees, about twice the rate during the Great Recession, while forgoing regularly scheduled wage increases for others.
1 ADP processes payroll for about 26 million US workers each month, representing the US workforce along many labor market dimensions. These sample sizes are orders of magnitude larger than most household surveys that measure individual labor market outcomes at monthly frequencies.
-
Employment declines during the Pandemic Recession were much larger for businesses with fewer than 50 employees, with closures playing an even larger role for this size group. Businesses with fewer than 50 employees saw paid employment declines of more than 25 percent through April 18, while those with between 50 and 500 employees and those with more than 500 employees, respectively, saw declines of 15-20 percent during that same period, and reached troughs a week or two later than the smallest businesses.

The largest declines in employment were in sectors that require substantive interpersonal interactions. Through late-April, paid employment in the “arts, entertainment and recreation” and “accommodation and food services” sectors (i.e., leisure and hospitality) both fell by more than 45 percent while employment in “retail trade” fell by almost 30%. Businesses like laundromats and hair stylists also saw employment declines of nearly 30%. Despite a boom in emergency care treatment within hospitals, the “health care and social assistance” industry experienced a 16.5% decline in employment through late April.

-

The spread of COVID-19 has not been uniform across the country. Urban areas have generally seen more aggressive spreads of the virus. These differences manifested themselves somewhat in the labor market as well. There is a strong relationship between the exposure to COVID-19 and employment declines.
While employment fell in all states, the employment declines were largest in those states that had more disease exposure. The authors compare two groups of states: (1) a set of large states that broadly opened in late April or early May (FL, GA and TX), and (2) a set of large states that broadly opened in late May and early June (IL, PA, VA and WA). Looking at employment in the Food and Accommodations Sector for both groups of states, the authors find employment in this sector fell similarly through mid-April in both state groupings. Starting in late April, employment in this sector within the states opening early increased faster than employment in the states opening later. In the states that opened early, however, employment in this sector is still 40 percent below February levels as of mid-May. This suggests that opening does not guarantee employment will fully rebound in these sectors.
The authors also found that employment in these sectors within states that opened later started to increase even prior to those states re-opening. While the increase was modest it showed that demand was increasing even before the states officially re-open. These findings suggest caution by researchers and policymakers alike seeking to link employment gains to re-opening schedules.
-

Through late April, women experienced a decline in employment that was 4 percentage points larger than men (22 percent for women to 18 percent for men). The gap has grown slightly to 5 percentage points through mid-May. These trends are in sharp contrast to prior recessions where men experienced larger job declines. Why are women being hit harder in the Pandemic Recession? The answer is not clear. One obvious factor is that traditionally female dominated industries, such as retail, leisure and hospitality industries, are being hit harder by the recession. The authors find, however, that less than 0.5 percentage points of the 4-5 percentage point difference in employment losses between men and women can be explained by industry. In other words, across industry sectors, women are experiencing larger job declines relative to men.
More research using household-level surveys with additional demographic variables can explore this critical question. It may be that other factors of the pandemic, such as an increased need for childcare, will explain some portion of the gender gap in employment losses during the recession.
-

The authors use anonymized bank account information on millions of JPMorgan Chase customers to measure how spending and savings over the initial months of the pandemic vary with household-specific demographic characteristics, like pre-pandemic income and industry of employment. The authors find that most households cut spending dramatically in early March, with declines particularly concentrated in sectors sensitive to government shutdowns and increased health risk, like travel, restaurants, and entertainment. Richer households, who typically spend more in these categories, cut their spending slightly more than poorer households.
Starting in mid-April, after government stimulus checks and expanded unemployment benefits are put in place, spending by poor households recovers more rapidly than spending by rich households. At the same time, poor households also have the largest growth in liquid checking account balances. Thus, poorer households simultaneously have faster growth of spending and savings starting in mid-April, even though they face greater exposure to labor market disruptions and unemployment. This suggests an important role for government transfers in stabilizing income and spending during the initial stages of the pandemic, especially for low-income households. This in turn suggests that phasing out broad stimulus too quickly could potentially transform a supply-side recession driven by direct effects of the pandemic into a broader and more persistent recession caused by declines in income and aggregate demand.
-

To address the gap in critical, real-time information about COVID-19’s effects on US income and poverty (official estimates will not be available until September 2021), the authors constructed new measures of income distribution and income-based poverty with a lag of only a few weeks, using high frequency data for a large, representative sample of US families and individuals. The authors relied on the Basic Monthly Current Population Survey (Monthly CPS), which includes a greatly underused global question about annual family income, and which allows them to determine the immediate impact of macroeconomic conditions and government policies.
The authors’ initial evidence indicates that, at the start of the pandemic, government policy effectively countered its effects on incomes, leading poverty to fall and low percentiles of income to rise across a range of demographic groups and geographies. Their evidence suggests that income poverty fell shortly after the start of the COVID-19 pandemic in the US. In particular, the poverty rate, calculated each month by comparing family incomes for the past twelve months to the official poverty thresholds, fell by 2.3 percentage points, from 10.9 percent in the months leading up to the pandemic (January and February) to 8.6 percent in the two most recent months (April and May). This decline in poverty occurred despite that employment rates fell by 14 percent in April—the largest one-month decline on record.
This research reveals that government programs, including the regular unemployment insurance program, the expanded UI programs, and the Economic Impact Payments (EIPs), can account for more than the entire decline in poverty that the authors find, and more than half of the decline can be explained by the EIPs alone. These programs also helped boost incomes for those further up the income distribution, but to a lesser extent.
-
Expected Rates of Employment Growth and Excess Job Reallocation Rate

Nearly 28 million persons in the US filed new claims for unemployment benefits over the six-week period ending April 25. Further, the US economy shrank at an annualized rate of 4.8% in the first quarter of 2020, and many analysts project it will shrink at a rate of 25% or more in the second quarter. Yet, even as much of the economy is shuttered, some firms are expanding in response to pandemic-induced demand shifts.
By pairing anecdotal evidence from news reports and other sources, along with the rich dataset provided by the Survey of Business Uncertainty (SBU), [1]the authors construct novel, forward-looking measures of expected job reallocation across US firms. The authors draw on two special questions fielded in the April 2020 SBU, one asks (as of mid-April) about the coronavirus impact on own-company staffing since March 1, 2020, and another asks about the anticipated impact over the ensuing four weeks. Responses reveal that pandemic-related developments caused near-term layoffs equal to 12.8 percent of March 1 employment and new hires equal to 3.8 percent. In other words, the COVID-19 shock caused 3 new hires in the near term for every 10 layoffs.
Firm-level sales forecasts show a similar pattern, further supporting the authors’ view that COVID-19 is a major reallocation shock. In addition, the authors’ measure of the expected excess job reallocation rate rose from 1.5% of employment in January 2020 to 5.4% in April. The April value is 2.4 times the pre-COVID average and is, by far, the highest value in the short history of the series.
The authors also draw on special questions put to firms in the May 2020 SBU to quantify the anticipated shift to working from home after the coronavirus pandemic ends, relative to the situation that prevailed before the pandemic. They find that full work days performed at home will triple in the post-pandemic economy. This tripling will involve shifting one-tenth of all full work days from business premises to residences (and one-fifth for office workers). Since the scope for working from home rises with worker earnings, the shift in worker spending power from business districts to locations nearer residences is even greater.
Finally, the authors find that much of the near-term re-allocative impact of the pandemic will persist, as indicated by their forward-looking reallocation measures and their evidence on the shift to working from home. Drawing on special questions in the April SBU and historical evidence of how layoffs relate to realized recalls, they project that 32% to 42% of COVID-induced layoffs will be permanent. The authors also construct projections for the permanent-layoff share of recent job losses from other sources, obtaining similar results.
[1] The SBU is a monthly panel survey developed and fielded by the Federal Reserve Bank of Atlanta in cooperation with Chicago Booth and Stanford.
-
Treasury Yields and Volatility Index (VIX) During the COVID-19 Crisis

During financial crises like in 2008, US Treasuries are typically viewed as the most liquid and safe assets in the world, reflected by their rising prices when markets rush to these relatively secure assets. However, this did not occur in March 2020 during the COVID-19 pandemic. True to script, stock prices fell dramatically, the VIX index of implied stock return volatility spiked, credit spreads widened, and the dollar appreciated. In sharp contrast to previous crisis episodes, though, prices of long-term Treasury securities fell sharply.
What happened? The authors review empirical evidence of investor flows and build a model to shed light on the mechanism behind this episode. Their model introduces repo financing as a key part of dealers’ intermediation activities, through which levered investors obtain funding from dealers who are subject to a balance sheet constraint–the Supplementary Leverage Ratio (SLR)–due to regulation reforms since the 2007–09 crisis. Consistent with their model, the spread between the Treasury yield and overnight-index swap rate (OIS) and the spread between dealers’ reverse repo and repo rates are both highly positive in the COVID-19 crisis, and both greatly negative in the 2007–09 financial crisis.
The observed movements in Treasury yields in March 2020 can be rationalized as a consequence of selling pressure that originated from large holders of US Treasuries interacting with intermediation frictions, including regulatory constraints such as the SLR. Evidently, the current institutional environment in the Treasury market is such that it cannot absorb large selling pressure without substantial price dislocations, or intervention by the Federal Reserve as the market maker of last resort. The safe asset status of US Treasuries’ should not be taken for granted.
-
Consumer Visits Over Time by Store Size/Traffic

The steep drop in US economic activity in recent months has been driven in large part by the fall-off in consumer spending at retail stores, restaurants, entertainment spots, and other social venues. This decline in spending has roughly correlated with government shelter-in-place (SIP) orders, and has given rise to fierce debates over “reopening” the economy. Were the various lockdown orders worth the economic pain of slowing the spread of the virus? When, and how fast, should economies reopen?
These questions presume that SIP orders were the primary determinant in keeping consumers at home. However, using data on foot traffic at 2.25 million individual businesses across the United States (including 110 industry groupings), the authors find that while total foot traffic fell by 60 percentage points, legal restrictions explain only around 7 percentage points of this decline. In other words, people were staying home on their own, and when they did go shopping, the authors found that consumers avoided larger, high-traffic businesses. Given the richness of their data set, and described in detail in their accompanying paper, the authors are able to compare, for example, two similar establishments within a commuting zone but on opposite sides of an SIP order. In such a case, both establishments saw enormous drops in customer activity, but the one on the SIP side saw a drop that was only about one-tenth larger.
Interestingly, and further supporting the modest size of the estimated SIP effects, when some states and counties repealed their shutdown orders toward the end of the authors’ sample, the recovery in economic activity due to the repeal was equal in size to the decline at imposition. Thus, the recovery is limited not so much by policy as the reluctance of individuals to engage in social economic activity.
-
Productivity's Components: An Example (2008-2016)

The world entered into the COVID crisis in the midst of an unexplained 15-year-long productivity growth slowdown, and the current decline of the world economy raises critical questions about the further trajectory of productivity growth. The authors consider the channels through which the crisis might shift the growth rates of productivity and output, whether up or down.
The authors note that measured productivity is likely to fall in the short run as workers are kept on companies’ payrolls while output declines. However, their concern is a more complete measure of productivity, or one that goes beyond traditional inputs like capital and labor to include any residual growth in output (what economists call total factor productivity, or TFP). Broadly summarized here, the authors describe three components of economy-wide TFP and possible impacts of the pandemic:
- Within-firm productivity growth. Firms build trust among customers and knowledge capital among employees, and both are in danger as the pandemic persists and customer needs go unmet or employees are lost. In addition, higher taxes and/or inflation in the future, as well as trade restrictions, could hamper a company’s recovery.
- Between-firm reallocation (e.g., unproductive firms close and labor and capital shifts to other firms). Small firms are likely to suffer most going forward and are more likely to close permanently. If these smaller firms are more innovative on average, economy-wide productivity growth could slow. Other firms, often larger, will exist primarily through government programs, some of which would otherwise have closed. These “zombie” firms might prevent other, more productive, firms from entering the market.
- Productivity generation created by the pure shifts of activities across sectors. Some sectors, like hotel and travel, may experience persistent drops in activity, while others, like healthcare and IT, may grow over time. The resultant reallocation of resources will have consequences for aggregate productivity, to the extent these sectors differ in productivity and expected productivity growth, and these differences will also occur across countries.
The authors acknowledge that long-term and, possibly, irreversible economic damage may occur from the COVID pandemic, and they urge policymakers to look beyond policies that protect existing businesses, and to enact policies that encourage productivity growth. Globalization, labor mobility, and small firms may all still fall victim to the crisis if the world does not succeed in reopening borders, refraining from trade and currency wars, and focusing on policies to boost productivity. On the upside, the broad adoption of new technologies – such as IT skills during the epidemic – and strong reallocation pressures may provide an independent boost on productivity as we come out of the crisis.
-
Expected Dividend and GDP Growth from Dividend Futures

The authors use data from the aggregate equity market and dividend futures to quantify how investors’ expectations about economic growth across horizons evolve in response to the coronavirus outbreak and subsequent policy responses. Dividend futures, which are claims to dividends on the aggregate stock market in a particular year, can be used to directly compute a lower bound on growth expectations across maturities or to estimate expected growth using a simple forecasting model. As of June 8, the authors’ forecast of annual growth in dividends is down 9% in the US and 14% in the EU, and their forecast of GDP growth is down by 2.0% in the US and 3.1% in the EU. As a word of caution, the authors emphasize that these estimates are based on a forecasting model estimated using historical data. In turbulent and unprecedented times, there is a risk that the historical relation between growth and asset prices breaks down, meaning these estimates come with uncertainty.
The lower bound on the change in expected dividends is -18% in the US and -25% in the EU on the 2-year horizon. The lower bound is model-free and completely forward looking. There are signs of catch-up growth from year 4 to year 10. News about economic relief programs on March 26 boosts the stock market and long-term growth but did little to increase short-term growth expectations. Expected dividend growth has improved since April 1 in both the US and the EU.
As of June 8, the expected return on the market has returned to the pre-crisis level. On June 8, the S&P 500 trades at $3232, which is $64 lower than the average price between January 1 and February 19. This drop can largely be explained by the first 7 years of dividends, as they are down by a total of $72. As such, the distant-future dividends, the dividends beyond year 7, must have approximately the same value as before the crisis. If expected long-run dividends are the same as before the crisis, expected returns on the long- run dividends must therefore also be the same as before the crisis. However, interest rates have dropped substantially, which means the expected return in excess of the interest rates is higher than before the crisis.
-
Spending Around Stimulus Payments

In response to the economic fallout of the COVID-19 pandemic, the US government has enacted the CARES Act, with over $2 trillion of stimulus measures. Amongst its various provisions, American households under certain income thresholds qualify to receive direct payments in the form of stimulus checks.* How did households respond to this cash infusion?
In updated research, the authors studied households’ consumption and spending behavior responses to the stimulus checks through a multitude of dimensions, using high-frequency, real-time household financial transaction data. By observing 44,460 individuals across the US who received stimulus checks, the authors found that households responded rapidly at first by increasing spending by $0.29 per dollar of stimulus during the first 10 days of observation, primarily on food and non-durable goods, and rent and bill payments. Households with lower incomes, greater income declines, and lower levels of liquidity exhibit relatively stronger spending responses.
Household liquidity plays the most important role in determining spending behavior, with no observed spending response for households with relatively higher levels of bank balances and ready access to funds. Compared to the 2001 recession and 2008 Financial Crisis, the study found relatively little increase in spending on durable goods, with a number of potentially important downstream implications for the economic recovery.
These findings could inform policy formulation and help reduce the time to gauge impact between a policy’s enactment and its implementation. Likewise, further debate is warranted on the timely targeting of stimulus checks, their distribution, and intended effects in jump starting consumer spending to facilitate recovery.
*Individuals earning less than $75,000 get checks worth $1,200, and $2,400 for married couples earning less than $150,000 – each qualifying child entitles the household to an additional $500 of direct payments. Single households earning between $75-99,000 get increasingly smaller checks, and those earning above $99,000 ($198,000 for couples) will not qualify for any stimulus checks.
-
Daily Price of Volatile Stocks (PVs)

Financial markets have fluctuated significantly as the COVID-19 epidemic has progressed.These fluctuations likely reflect both the anticipation of a steep drop in corporate earnings, as well as a reassessment of the risk of business investment. It is important to separate these two factors because upward revisions in risk perceptions can themselves reduce investment, deepening and prolonging the recession.
To understand movements in risk perceptions relevant for the macroeconomy in near real-time, the authors employ the “price of volatile stocks” (PVSt)1, which is the book-to-market ratio of low-volatility stocks minus the book-to-market ratio of high-volatility stocks. In previous work, the authors showed that PVSt is low when perceived risk directly measured from surveys and option prices is high. Further, using time-series data from 1970 to 2016, the authors showed that when perceived risk is high according to PVSt, future real investment tends to be lower because the cost of capital is higher for risky firms.
Figure 1 shows a daily time series of the authors’ measure of perceived risk, PVSt, from 1970 and through April 2020. It shows the price of volatile stocks fell sharply – and hence perceived risk rose sharply – as news about COVID-19 was hitting US markets and households in March 2020. PVSt reached its low for the year on April 3, 2020, when it was down 2.6 standard deviations from its level at the start of 2020. While this decline is large, it is comparable to movements in risk perceptions in prior recessions, particularly the downturn following the dotcom bubble in the early 2000s. It is also much smaller than the move in risk perceptions during the financial crisis of 2008-2009. Estimates for the period 1970-2016 indicate that a move in risk perceptions of the size experienced from the beginning of the year until this trough has typically been associated with a drop in the natural real risk-free rate of 3.3 percentage points, and a decline in the ratio of economy-wide capital expenditures to total assets of ratios of 0.91 percentage points (relative to a pre-2016 standard deviation of 1.16%).
Figure 2 provides a close-up view of PVSt and the aggregate stock market during the COVID-19 pandemic (February 14, 2020 through April 30, 2020). The figure shows that PVSt is useful for interpreting individual events during the COVID-19 crisis and often contains information that is distinct from the aggregate stock market. One thing that stands out from this figure is that the steep drop in the aggregate stock market at the end of February left PVStalmost completely untouched, implying that perceptions of risk had not changed significantly. In other words, the evolution of PVSt at the onset of the crisis suggests that investors initially believed there would be a short-term decline in earnings, but did not believe there would be an amplification effect from heightened risk perceptions to the aggregate economy. However, PVSt and the aggregate market began to drop in tandem around March 11, the day the WHO declared COVID-19 a pandemic and wide-spread international travel restrictions were imposed. One possible interpretation for this decoupling and recoupling is that COVID-19 initially appeared to affect only the short-term cash flows of internationally connected firms, whereas the spread of the virus and the associated policy measures imposed in mid-March affected the risk outlook for a much broader swath of the economy. These trends were in turn reflected in the prices of volatile stocks.
Another striking feature of Figure 2 is the large increase in PVSt that began on April 21, 2020, the day that the United States Senate passed the Paycheck Protection Program and Health Care Enhancement Act. The bill provided nearly $500 billion in additional funding to support the CARES Act, much of which was geared towards aiding small and medium-sized businesses. PVSt increased nearly 0.66 standard deviations between the time that the bill was passed in the Senate and when it was signed into law by President Trump on April 24. Interestingly, the market-to-book ratio of the aggregate stock market increased only 0.17 standard deviations over the same time period. The differential response of PVSt and the aggregate stock market to the passing of the bill is consistent with the authors’ previous interpretation that PVSt reflects perceptions of risk that are relevant for privately owned firms, which tend to be smaller and riskier than the larger, less volatile publicly traded firms that dominate the aggregate stock market.
1 As developed in Pflueger, C., E. Siriwardane, and A. Sunderam (2020). “Financial market risk perceptions and the macroeconomy.” Quarterly Journal of Economics, forthcoming.

-
Reversing the Curve

As more countries, states, and municipalities begin to reopen their businesses and public spaces in response to the ongoing COVID-19 pandemic, one constant refrain is the warning that we will just get back to square one, with the pandemic running its course and the death toll rising once again, as everyone will get back to normal. But will they? How far might people go in practicing precaution on their own by adjusting their social and economic behavior, without government stay-at-home orders, and how will that affect the economy and the dynamics of the pandemic?
To address this question, the authors developed a simple model based on other recent research, which includes agents (people) who are aware of infection and death risks if they continue to leave their homes to work and to shop, among other activities. Faced with these risks to their own health, they will adjust their behavior. This is a key element of economic models, and is a feature that is not part of standard epidemiological models.
Crucially and in departure from other economic models, the authors assume that the economy is composed of sectors that differ in their infection probabilities. This heterogeneity is simply illustrated, for example, by people’s choice to eat a pizza delivered to their home vs. in a restaurant, or to work at home rather than in an office (if they are among those able to work from home). This heterogeneity matters. The way people choose to “consume” public experiences—whether work, worship, or entertainment—has a profound impact on infection rates.
Broadly summarized, when the authors run their model without heterogeneity in infection risk across sectors, economic activity declines 10%. However, the introduction of heterogeneity mitigates much of that decline. Likewise, the majority of deaths are avoided after the first year, compared to the homogeneous sector version. Importantly, these results are realized without government intervention. One can think of these results as capturing some of the experiences with Sweden’s less-restrictive approach to COVID-19 management. Better, these results are indicative of the unfolding dynamics subsequent to re-opening: a modest rise in infection, a very persistent, but modest decline in economic activity, and a substantial and prolonged shift across sectors, which flexibility of labor markets needs to allow for. This is far from a return to normal, but it is a reasonably optimistic outlook nonetheless.
What explains these outcomes? The authors suggest that infections may decline due to the re-allocation of economic activity that people will make on their own, and the resulting and longer-lasting shift between sectors. For the rather benign outcome in the model and for successful sectoral shifts, it is key that workers can adjust rather quickly to the changing labor market. Food servers can become delivery drivers. Former shop clerks find employment in Amazon warehouses. Artists provide entertainment online. Jobs lost in some sectors get partly offset by recruitment in others.
The authors acknowledge that labor markets do not function as smoothly as they assume in their model. The authors stress that their results are not definitive in and of themselves; models are approximations of reality that depend greatly on the parameters applied by researchers. In this case, the authors concede that the results may appear Panglossian.
However, one need not wear rose-colored glasses to recognize that private incentives can shape behavior during a health pandemic. Most importantly, allowing the economy to succeed in shifting sectoral activities in response to these choices is key for mitigating both the economic as well as the health impact. Consideration of such incentives and sectoral shifts could be important as governments around the world consider strategies to reopen public activities.
-
Disclosure Policy: Detected Cases and Deaths in Seoul, South Korea

South Korea’s success in battling COVID-19 is largely due to its widespread testing and contact tracing, but its key innovation is to publicly disclose detailed information on the individuals who test positive for COVID-19. This new research reveals that public disclosure measures are more effective at reducing deaths than comprehensive stay-at-home orders.
The COVID-19 outbreak was identified in South Korea on January 13, and since then South Koreans have received text messages whenever new cases were discovered in their neighborhood, as well as information and timelines of infected persons’ travel. The authors combined detailed foot-traffic data in Seoul with publicly disclosed information on the location of individuals who had tested positive. The results reveal that public disclosure can help people target their social distancing, which proves especially helpful for vulnerable populations who can more easily avoid areas with a higher rate of infection.
The authors estimate that over the next two years, the current strategy in Seoul will lead to a cumulative 925,000 cases, 17,000 deaths (10,000 for those 60 and older and 7,000 for ages 20 to 59), and economic losses that average 1.2 percent of GDP. In a model representing partial lockdown, the authors estimate the same number of cases, but deaths increase from 17,000 to 21,000 (14,000 for those 60 and older and 7,000 for ages 20 to 59) and economic losses increase from 1.2 to 1.6 percent of GDP.
Importantly, while death rates among older populations are significantly higher under lockdowns, those under 60 suffer economic losses twice as high, compared to South Korea’s current strategy.
In the absence of a vaccine, the authors conclude that targeted social distancing is much more effective in reducing the transmission of the disease, while minimizing the economic cost of social isolation. However, they also note that these benefits come with a cost: Disclosure of public information infringes upon the privacy of affected individuals. The authors anticipate the day when cost measures for privacy loss are available, after which a full cost/benefit analysis is possible.
-
Two Steps to Encourage COVID-19 Tests and Quarantines

Testing for COVID-19 is only as good as compliance. If people don’t show up for testing, or if only symptomatic people show up, then the benefits of such a program will be lost, as “silent spreaders” will go undetected. Indeed, costs could increase under such a scenario if people are encouraged to re-engage in the economy under the false promise of such a testing program.
The question, then, is how to encourage healthy people to stand in line with, possibly, sick people, to undergo an uncomfortable test, and then return in two weeks to do it again, and for many weeks after that. The answer lies at the heart of economics—incentives—and the authors offer a unique suggestion: a COVID lottery (which they coin “Pandemillions”) that gives away large prizes every week to random test participants. On Sunday mornings, for example, states would notify individuals selected for testing that week, and those people would then have until the end of the week to get tested. A completed test would convert into a “ticket” in the lottery, with winners announced every Saturday night.
The benefits of widespread testing would be large, and the federal government could afford to fund a very lucrative prize pool. At $200 million per week, the annual cost of the lottery would only be only $10 billion, or roughly 0.5% of the cost of the CARES Act. As to implementation, while a federal lottery might be optimal, given that 45 states already manage lotteries, the best path forward might be to use existing state infrastructure.
For those who need incentive to quarantine once they test positive, the authors recommend a second plan: offer a $2,000 weekly payment for every American adult compelled to stay home, even if they are asymptomatic. Based on quarantining up to 20 million people this year, the cost would approach $80 billion, a large but still quite modest sum compared to the total costs of this pandemic.
Strong incentives cause strong reactions, and it is possible that some individuals would purposefully try to contract COVID-19 to receive stay-at-home payments; however, the authors believe this number would be sufficiently low and would not come close to outweighing the program’s significant benefits. The authors also acknowledge that while such payments would likely face political hurdles, the high returns from such a program—in morbidity and mortality reductions, and resources saved—would also prove politically attractive.
Absent a vaccine, which is at best a number of months out, the best way to safely reopen the economy is to establish a testing regimen for COVID-19 which ensures that all individuals—both symptomatic and asymptomatic—get tested on a regular basis.
-
UI Benefit Replacement Rates
One provision of the CARES Act created an additional $600 weekly unemployment benefit to help workers losing jobs as a result of the COVID-19 pandemic. The authors use micro data on earnings together with the details of each state’s UI system under the CARES Act to compute the entire distribution of current UI benefits and show how replacement rates vary across occupations and states.
The authors find that 68% of unemployed workers who are eligible for UI will receive benefits that exceed lost earnings. The median replacement rate is 134%, and one out of five eligible unemployed workers will receive benefits at least twice as large as their lost earnings. We also show that there is sizable variation in the effects of the CARES Act across occupations and across states, with important distributional consequences. For example, the median retail worker who is laid-off can collect 142% of prior wages in UI, while grocery workers are not receiving any automatic pay increases. Janitors working at businesses that remain open do not necessarily receive any hazard pay, while unemployed janitors who worked at businesses that shut down can collect 158% of their prior wage.
After documenting these basic patterns, the authors explore how various alternative UI expansion policies would alter the distribution of replacement rates. We show how the parameters of various simple UI expansion policies shape the entire distribution of UI benefits across workers and thus provide a lens into how policy choices jointly affect liquidity provision, progressivity, and labor supply incentives.


-
Optimal Targeted Closures for NYC

The spread of infectious disease has an important spatial component: When individuals from one neighborhood visit another one they can infect others or get infected. Closure of businesses and public places in a neighborhood could reduce such infection opportunities as well as the import/export of the disease from/to other neighborhoods. How should a city target closures to achieve an appropriate policy goal at the lowest possible economic cost, factoring in neighborhood spillovers and the differences among neighborhoods’ economic values?
To answer this question, the authors focus on the policy goal of reducing infections in all neighborhoods, and provide an optimization framework that delivers the optimal targeted closure policies. They then use mobile-phone data (from a period prior to lockdowns) to estimate individuals’ movements within NYC and, applying their framework, the authors reveal the following:
- Targeted closures could achieve the aforementioned policy goal at up to 85% lower economic cost than the uniform city-wide closures.
- Second, coordination among counties and states is extremely important. It may be infeasible for NYC to achieve the policy goals and curb the spread of the epidemic unless the neighboring counties (e.g., those in New Jersey) also impose appropriate economic closure measures.
- Third, the optimal policy promotes some level of economic activity in Midtown, while imposing closures in many neighborhoods of the city.
- Finally, contrary to likely intuition, the neighborhoods with larger levels of infections are not necessarily the ones targeted for the most stringent economic closure measures.
-
COVID Cases, Lockdown, and Mobility

Using customized large-scale surveys, this work provides real-time estimates on the changing economic landscape following lockdowns. The authors find that consumer spending for a typical US household dropped by $1,000 per month, which corresponds to a 31% drop in overall spending. Households also spent substantially less on discretionary expenses and decreased their planned spending on durables, with an average drop in spending on durables of almost $1,000.
Strikingly, they find one of the largest drops occurring for debt payments. This result highlights the possibility of a wave of defaults in the next few months, which could ultimately affect the financial system, slow the economic recovery and explain the recent increase in loan provisions by major US banks.
In line with these negative outcomes at the individual level, households’ macroeconomic expectations have become far more pessimistic. Average perceptions of the current unemployment rate increased by 11 percentage points, with similar magnitudes for expectations of unemployment over the next three to five years, indicating that households expect the downturn to have persistently negative effects on the labor market. Consistent with this view, inflation expectations over the next twelve months dropped sharply on average while uncertainty increased. Current mortgage rate perceptions as well as expectations for the end of 2021 dropped on average by about 0.4 percentage points with even larger drops in average expectations over the next five to ten years.
The negative effect on long-run expectations suggests that the lower bound on nominal interest rates might be a binding constraint for monetary policymakers for the foreseeable future. Increased uncertainty at the household level and the large drop in planned spending point toward some form of liquidity insurance to curb the desire for precautionary spending and stimulate demand once local lockdowns are lifted.
Finally, to assess the economic damage that households attribute to the virus, the authors elicited information on the perceived financial situation of the survey participants and possible losses due to the coronavirus, both in income and wealth. Forty-two percent of employed respondents reported having lost earnings due to the virus with an average loss of more than $5,000. More than 50% of households with significant financial wealth reported having lost wealth due to the virus and the average wealth lost is at $33,000. This decline in wealth is putting further downward pressure on future consumption.
-
Using data from ADP[1] one of the world’s largest human resources management companies, to measure changes in the US labor market during the early stages of this “Pandemic Recession,” the authors find that paid US employment declined by about 22% between mid-February and mid-April, 2020. This translates to a reduction in US employment of about 29 million workers as measured in the payroll data. In no prior recession since the Great Depression has US employment declined by a cumulative 2% during the first three-months of the recession (Chart 1). Across all prior recessions since the 1940s, peak employment declines were never more than 6.5%. The US economy has already experienced a 22% decline in employment during the first month of this recession (Chart 2).
Among other important findings, the authors reveal that employment declines were disproportionately concentrated among lower-wage workers: 35% of all workers in the bottom quintile of the wage distribution lost their job, at least temporarily, during the first month of the recession. The comparable number for workers in the top quintile was only 9% (Chart 3). This implies that over 36% of the 29 million jobs lost during the first four weeks of this recession were concentrated among workers in the lowest wage quintile. Job declines were larger in-service industries (such as leisure and hospitality) and in smaller firms, which disproportionately employ lower-wage workers (Chart 4).
The recession is having a disproportionate effect on small firms and lower-skilled workers: precisely those without the cash flow and savings to smooth consumption. The longer the recession persists, the greater the likelihood that lower wage workers may suffer the disproportionate brunt of the recession.

[1] ADP processes payroll for about 26 million US workers each month, representing the US workforce along many labor market dimensions. These sample sizes are orders of magnitude larger than most household surveys that measure individual labor market outcomes at monthly frequencies.
-
Who Has Born the Risk of Job Loss?

Social distancing policies have led to many workers losing their jobs, at least temporarily, and the burden of job loss has mostly fallen on economically vulnerable workers. New research reveals that employment losses are around four times larger for workers without a college degree, one and half times larger for non-white workers, and five times larger for workers in the bottom half of the income distribution (see figure). This is related to the characteristics of the jobs of these types of workers. Poor and economically disadvantaged workers are more likely to be employed in jobs that are less likely to be conducted from home. These jobs also tend to rank highly in terms of the amount of close physical interaction that occurs at work (e.g., a nail salon worker). Combined, these results imply that workers that have been hurt most by the crisis economically, are also at the highest health risk as they go back to work.
-
Business Shutdown

This paper takes an early look at a large and novel small business support program that was part of the initial crisis response package, the Paycheck Protection Program (PPP).
First, we find no evidence that funds flowed to areas that were more adversely affected by the economic effects of the pandemic, as measured by declines in hours worked or business shutdowns. If anything, we find some suggestive evidence that funds flowed to areas less hard hit. The fraction of establishments receiving PPP loans is greater in areas with better employment outcomes, fewer COVID-19 related infections and deaths, and less social distancing.
Second, lender heterogeneity in PPP participation appears to be one reason why we find a weak correlation between economic declines and PPP lending. For example, we find that areas that were significantly more exposed to banks whose PPP lending shares exceeded their small business lending market shares received disproportionately larger allocations of PPP loans. Underperforming banks—whose participation in the PPP underperformed their share of the small business lending market—account for two-thirds of the small business lending market but only twenty percent of total PPP disbursements. The top-4 banks alone account for 36% of the total number of small business loans but disbursed less than 3% of all PPP loans.
Our results highlight the importance of banks as a conduit for public policy interventions. Measuring these responses is critical for evaluating the social insurance value of the PPP and similar policies.
-
Size of the Indirect Effect of Reduced Commerzbank Lending

The COVID-19 pandemic initially led governments to shut down a few sectors, for example the service, hospitality, and travel industry. Huber’s 2018 study highlights that such disruptions can harm the entire economy, even if they initially only affect a few companies. To make this point, Huber shows that Commerzbank, one of Germany’s largest banks, cut lending to its German borrowers during the 2008-09 financial crisis. The lending disruption reduced the growth of companies that relied directly on loans from Commerzbank.
Importantly, the disruption also affected companies and employees that had no direct relationship with Commerzbank. Indirectly affected companies experienced spillover effects due to both a general decline in demand and a temporary lack of innovation at directly affected companies. When Commerzbank’s customers made job cuts, overall household consumption fell, which then affected revenue and employment at other companies. Further, declining research-and-development activities at directly affected companies spilled over to other companies, thus slowing overall productivity growth. The employment of indirectly affected companies remained low even beyond the duration of the initial lending disruption.
These findings may apply to the current economic shock due to the COVID-19 pandemic. For example, if directly disrupted companies fire workers, those workers will spend less, which will spill over to negatively affect other firms. Moreover, the economic harm of the current crisis may last longer than the actual disruption due to COVID-19.
-
Truck Flows Among Provincial Chinese Capital Cities

The Chinese government ended the 76-day lockdown of Wuhan on April 8, 2020. Outside Wuhan, many local governments had already eased restrictions on movement and shifted their focus to reviving the economy. In this work, the authors document the post-lockdown economic recovery in China. The main findings are summarized as follows:
- Official statistics suggest a quick recovery in manufacturing, which is corroborated in non-official data on city-to-city truck flows (see Figure 1) and air pollution emissions (see Figure 2).
- Electricity consumption, retail sales and catering income suggest a much more persistent output decline in services. Business registration data also show less firm entry in services.
- There is huge cross-region heterogeneity, with the southeast region experiencing the strongest initial recovery, according to the authors’ data.
- Small businesses were hit hard, with February sales down 35% from 2019, and they grew slowly in March. April will be the key month to determine the recovery speed.

-
How Negative Supply Shocks Can Lead to Demand Shortages

Understanding the nature of a negative economic shock is key to getting the policy prescription right. After ensuring that households have enough short-term resources, policymakers are confronted with the following conundrum: Should the aim of policy be to encourage people to spend more, that is to provide stimulus, or should policy focus purely on providing forms of social insurance?
The authors’ key insight is that the coronavirus shock is a supply shock of a special nature, as it affects different sectors unevenly. The central argument of their work is that the coronavirus shock will likely cause a reduction in aggregate demand larger than the original reduction in labor supply, something that the authors coin a “Keynesian supply shock.” Their work describes two forces that propagate the shock from those it directly affects, or those in affected (or contact-intensive) sectors, to those in less affected sectors: complementarities across sectors and incomplete markets. In the first case, when people are restricted from spending on certain goods, like restaurants and events, they do not spend the same amount on other complementary goods and services, and there is less overall spending
In the second case, the overall reduction in spending spreads to unaffected sectors because those who retain their jobs do not spend enough to prevent this occurrence (in economists’ parlance, the marginal propensity to consume of those in the unaffected sectors is less than those in affected sectors). Together, these two forces transform the original supply shock into a demand shock.
The authors’ findings pose challenges for policymakers, as a “typical” increase in government consumption may be less powerful in a pandemic shock. The reason is that government spending can only lift incomes in the unaffected sectors, not in the affected sectors, but it’s the workers in the affected sectors who have the highest propensity to consume, and they are exactly those who cannot benefit from an aggregate spending increase. On the other hand, fiscal stimulus can be desirable when combined with polices more targeted towards the workers in the affected sectors.
-
Device Exposure is Down by Two-Thirds

Throughout the United States, large swathes of economic activity and social life have been paused due to the pandemic. Data based on smartphone movements reveal this abrupt shift and can be used to study—almost in real-time—how people are altering their behavior during the coronavirus pandemic. A team of economists from five different universities that includes Chicago Booth’s Jonathan Dingel has published indices derived from anonymized phone data to allow researchers to use this information.
One of the team’s indices describes a device’s exposure to other devices due to visiting the same commercial venue. This daily device exposure index (DEX) reports the average number of distinct devices that also visited any of the commercial venues visited by a device on that day. Nationwide, the DEX declined dramatically over the month of March. By late March, device exposure was about one-third the level typically observed in February.
Thanks to the smartphone data’s rich detail, device exposure can be measured on a daily basis for more than 2,000 US counties. While exposure is down by two-thirds on average, there is considerable variation in the degree of isolation across US cities. On April 3, the device exposure indices in New York City and Las Vegas were merely one-tenth their Valentine’s Day levels. By contrast, the DEX for Cheyenne, Wyo., declined by only 40%. Across metropolitan areas, the decline in device exposure was greater in cities where a larger share of jobs can be done at home.
While the correlation between reduced device exposure and a greater share of jobs that can be done at home does not establish a causal relationship, this finding illustrates just one of numerous questions that can be investigated using these exposure indices made available to the global research community by the team of economists. The data are available online at https://github.com/COVIDExposureIndices/.

-

Most states and cities in the US have shut all non-essential businesses in response to COVID-19. In this note, we argue that as policies are developed to “re-open” the economy and send people back to work, strategies for childcare arrangements, such as reopening schools and daycares, will be important. Substantial fractions of the US labor force have children at home and will likely face obstacles to returning to work if childcare options remain closed.[1] Younger workers, who might be able to return to work earlier to the extent that they are less susceptible to the virus, are also more likely to require childcare arrangements in order to return to work.
Using 2018 data from the Census Bureau’s American Community Survey, we calculate the share of employed households who are affected by childcare constraints.[2] We focus on the civilian employed population older than 18.
The first row in Table 1 shows that 32% of that workforce has someone in their household who is under 14. Thus, 50 million Americans must consider childcare obligations when returning to work. Daycares and preschools might open sooner than primary schools, since they tend to have fewer children and thus less scope for disease transmission, so the remaining columns of Table 1 distinguish children under 6 and those 6-14 years old. For about 30% of the workforce with childcare requirements, all of their children are under the age of 6. Thus, opening daycares alone could address childcare obstacles for one in three constrained workers.
Of course, many workers with children at home are not sole caregivers. Workers who live in a household with another non-working adult – such as a partner who is not employed, a retired parent or in-law, or an older child above 18 who lives at home – can likely return to work while another household member addresses their childcare needs. The second row of Table 1 reports the share of all workers who live in a household with someone under 14 and no available caregiver. If non-working adults can assume household childcare responsibilities, 21% of the workforce would nonetheless have unaddressed childcare obligations.
Although 21% of the workforce will face some childcare burden when schools and daycares remain closed, some of them may resume work while other workers in their household address childcare needs. In particular, many workers with children live in households with other workers. Each household would potentially only need one adult to remain home with the children, freeing up the other adults to return to work. The third row of Table 1 shows that accounting for these childcare options leaves 11% of the workforce (or 17.5 million workers) facing major barriers to work if schools and daycares remain closed.
The White House and various other commentators have proposed a phased reopening of the economy in which initially only younger, less vulnerable workers return to work (https://www.whitehouse.gov/openingamerica/). Schools, daycares, and camps are proposed to open in later phases. Since older patients are more vulnerable to COVID-19, this would potentially balance the health risks for the most at-risk population while promoting economic activity. However, the obstacles to returning to work imposed by school closings are somewhat higher for the under 55 population, because 40% of these workers have a child at home. Table 1 shows that 14% (or roughly one in seven) of workers under 55 would likely face childcare-related obstacles to returning to work (even after accounting for the fact that in this scenario, workers over 55 in the household could then provide childcare). Under a policy where young workers return to work while schools remain closed, 35 million workers who are over 55 would not be able to return to work and another 16 million who are under 55 would be constrained by childcare obligations.

The obstacles that childcare imposes on workers during the COVID-19 crisis is similar across industries. Table 2 shows the key statistics for each broad industry category: the share of workers without within-household child care would only range from 18% in transportation to 25% in education and health care.
Figure 1 depicts spatial variation in the share of workers with childcare obligations and no available caregiver in their household. While this figure is as low as 13% and as high as 33% for some commuting zones, the vast majority of regions are near the national average of 21%. Thus, addressing childcare obligations as part of “re-opening” strategies is an important consideration for policymakers across the United States.
These results suggest that childcare-related constraints imposed by school closings should feature prominently in discussions of reopening the economy. While there is scope for a large rebound in employment even if schools and daycares remain closed, the economy will remain 17 million workers short of normal employment in this scenario. Furthermore, many of those working when schools are closed will only be able to do so if a spouse or partner or who would typically be working instead remains home. The longer school closures persist into the recovery of the economy, the greater will be the burden faced by those workers with young children and no obvious childcare options. We again note that we are making no attempt to evaluate any public-health benefits of school closures or make any assessment of when schools should be reopened. Public-health policies that mitigate the spread of the virus likely have high returns for the ultimate shape of any economic recovery. We instead simply note that discussions of returning to work ought to include discussion of returning to school.

References
Alon, Titan, Matthias Doepke, Jane Olmstead-Rumsey, and Michele Tertilt. “The Impact of COVID-19 on Gender Equality”, Covid Economics: Vetted and Real-Time Papers, Issue 4, April 14 2020.
[1] We explicitly refrain from any evaluation of public-health considerations related to school closures since we have no expertise in this area. We instead seek to focus solely on measuring economic constraints that arise in a phased employment recovery. It is entirely possible that these constraints may be unavoidable for public-health reasons.
[2] Alon, Doepke, Olmstead-Rumsey and Tertilt (2020) use ACS data to compute a number of closely related statistics, but they focus on measuring household childcare burdens while we use employed workers as our unit of analysis and focus specifically on measuring the importance of childcare constraints for aggregate, regional, and industry employment.
-
Estimated Paycheck Protection Program (PPP) Cost by Industry

The initial allotment for the Small Business Administration’s Paycheck Protection Program (PPP) was $349 billion, and was meant to cover primarily employee costs—including some funds for utilities, rent, and mortgage interest—for approximately eight weeks. However, many in Congress now deem this insufficient and the Treasury Dept. has requested an additional $250 billion, bringing the potential total to $599 billion. This begs the question: How many applications could be submitted and how big should PPP be? The authors calculate that maximum requests could total $720 billion (updated 4/16) if all small businesses in the US apply.
To make their calculations (see Paycheck Protection Program Calculation Tool online), the authors determined two pieces of information: the number of eligible businesses, and those businesses’ monthly payroll costs, including salaries, wages, retirement, and benefits. Eligible businesses include those with less than 500 employees, with an exception for larger businesses in the accommodation and food service sectors. In sum, the authors calculate about $3.4 trillion in total estimated payroll cost for the purposes of PPP that, when divided by 12 and multiplied by 2.5 to get the total eligible loan amount, comes to about $720 billion.
If Congress decides to increase the pool of funds to $600 billion, the PPP should be at least close to sufficiently funded to fulfill all application requests, mitigating the problems of the “first-come, first-served” design. However, it is also true that at $600 billion, Congress and taxpayers would not just fund a subset of small businesses in need, but would instead fund nearly the entire payroll for all small businesses for two months.
-
How Long Will This Last? Fraction Who Believe Crisis Will End Before Each Date

Small businesses account for nearly 50 percent of US workers, and this new survey of nearly 6,000 firms reveals the financial fragility of many of those businesses and signals a cautionary note for policymakers, as most respondents expect the crisis to extend beyond the spring and well into the summer.
The late-March 2020 survey focused on assessing small businesses’ current financial status, the extent of temporary closures and laid-off employees, duration expectations and the impact on decision-making, and whether businesses planned to apply for CARES Act funding and how such a decision could impact closures and lay-offs. Broadly, the survey revealed the following:
- Disruption to US small businesses is severe, with 43% of the respondents temporarily closed. Employee reductions stood at 40% across all respondents. Regionally, mid-Atlantic states, including New York City, reported closures of 54% and layoffs of 47%. Industry responses varied widely, with service sector firms reporting employment declines over 50 percent.
- Many US small businesses are standing on financially shaky ground, with the median firm with expenses over $10,000 per month retaining only enough cash to last for two weeks. For 75% of respondents, there was only enough cash to cover expenses for two months or less.
- US small businesses are widely uncertain about when the crisis will end, with half expecting the crisis to persist into mid-summer, meaning that many firms expect this economic challenge to persist well beyond their available cash levels.
For policymakers, the following results are particularly salient:
- More than 13% of respondents did not plan to seek CARES Act funding because of application hassle, distrust that loans will be forgiven, and eligibility complexity.
- If the crisis extends beyond four months, many firms—especially many in the service industries—do not expect to remain viable.
- Extrapolating the 72 percent of businesses that would apply for CARES Act funding, and assuming all businesses would request maximum loans (2.5 months of expenses), the total volume of loans from all US businesses would approach about $410 billion, beyond the $349 allocated in the CARES Act at the time of the survey.
-
Varying Income Levels by County (2016)

Shelter-in-place policies reduce social contact and risks of interpersonal COVID-19 transmission. Though the economic consequences of these policies are substantial, local non-compliance creates public health risks and may cause regional spread. Understanding the drivers of what enhance or mitigate compliance is a first order public policy concern.
Clarifying these mechanisms provides actionable insights for policy makers and public health officials responding to the COVID-19 pandemic.
In our paper, we find a significant decline in population movement after the local shelter-in-place policies were enacted. Second, an increase in local income enhances compliance. Third, tariff-induced economic dislocation and higher Trump vote shares in 2016 reduce compliance. Finally, exposure to slanted media reduces compliance, consistent with the impact of information sources that downplayed the danger of COVID-19.

-
Estimated Reported Infections by County

The novel coronavirus outbreak was declared a national emergency in the US beginning March 1, 2020, with states imposing various levels of lockdown measures. By April 13, there were nearly 550,000 confirmed cases in the US, with deaths approaching 22,000.[1] While this is clearly a major health crisis, the country is also facing a deep and possibly long-lasting economic recession. One crucial question looming over both the health and economic effects is how many people have actually contracted COVID-19 and the actual mortality rate; that is, while the number of confirmed cases is known, there are likely a large number of cases that have not been confirmed and, likewise, some deaths that have not been attributed to COVID-19.
To address this crucial knowledge gap, the authors have developed a unique strategy to estimate the likely real impact of the COVID-19 pandemic on the US. This strategy is based on the variation in travel from the epicenter of an outbreak to other locations that were not previously infected. Through a series of estimates based on known infection rates and expected rates of transmission, and incorporating the likely effect of travel from an epicenter of an outbreak to other areas, the authors estimate the percentage of unreported cases. The results are striking: for example, on March 13, across major metro areas, the authors estimate that on average only 4.16% of total infections were reported across the US with an eight-day reporting lag, meaning that for every case there were 23 unreported cases. The range of results across model assumptions and time periods utilized vary between 6 to 24 unreported cases.
Finally, while the authors stress that their results are dependent on strong assumptions and reliable data, they believe their methodological strategy is a solid start that can fuel additional research.
-
The authors focus on three key variables: the employment-to-population ratio, the unemployment rate, and the labor force participation rate. Historically, the employment-to-population ratio and the unemployment rate are near reverse images of one another during recessions, as workers move out of employment and into unemployment. More severe recessions also sometimes lead to a phenomenon of “discouraged workers,” in which some unemployed workers stop looking for work. These workers are reclassified as “out of the labor force” by Bureau of Labor Statistics (BLS) definitions, so the unemployment rate can decline along with the labor force participation rate while the employment-to-population ratio shows little recovery.
The authors figures, based on survey data from Coibion et al. (2020), document the following three facts. First, the employment-to-population ratio has declined sharply from 60% down to 52.2% (Panel B). This decline in employment is equivalent to 20 million people losing their jobs and is larger than the entire decline in the employment to population ratio experienced during the Great Recession. Second, the unemployment rate rose from 4.2% to 6.3% (Panel A). While this increase is the single biggest discrete jump in unemployment over the last 15 years, this change in unemployment corresponds only to about one-third of the increase observed during the Great Recession. For comparison with the employment-to-population ratio, if all twenty million newly unemployed people were counted in the unemployment rate, there would have been an increase in the unemployment rate from 4.2% to 16.4%, the highest level since 1939. Third, the reason for the discrepancy between the two is that many of the newly non-employed people are reporting that they are not actively looking for work, so they do not count as unemployed but rather as exiting the labor force. The labor force participation rate dropped from 64.2% to 56.8% (Panel C). Our survey evidence suggests that 6 percentage points of the decline and, hence, almost the entire decrease can be explained by people moving out of the labor force into retirement.
-
Time Paths Under Baseline Parameters

The typical approach in the epidemiology literature is to study the dynamics of the pandemic–for infected, deaths, and recovered–as functions of some exogenously chosen diffusion parameters, which are in turn related to various policies, such as the partial lockdown of schools, businesses, and other measures of diffusion mitigation. We use a simplified version of these models to analyze how to optimally balance the fatality induced by the epidemic with the output costs of the lockdown policy. The planner’s objective is to minimize the present discounted value of fatalities while also trying to minimize the output costs of the lockdown policy.
In our baseline parameterization, conditional on a 1% fraction of infected agents at the outbreak, the possibility of testing and no cure for the disease, the optimal policy prescribes a lockdown starting two weeks after the outbreak, covering 60% of the population after one month. The lockdown is kept tight for about a full month, and is subsequently gradually withdrawn, covering 20% of the population three months after the initial outbreak. The output cost of the lockdown is high, equivalent to losing 8% of one year’s GDP (or, equivalently, a permanent reduction of 0.4% of output). The total welfare cost is almost three times bigger due to the cost of deaths. The intensity of the lockdown depends on the gradient of the fatality rate as a function of the infected, the value of a statistical life, and the availability of testing. We find that an antibody test, which allows to avoid lockdown of those immune, improves welfare by about 2% of one year’s GDP.
-
Equity Returns for U.S. Life Insurance Sector During COVID-19 Crisis

The stock prices of life insurance companies declined sharply during the onset of the COVID-19 crisis. To illustrate this, the figure reports the drawdown, defined as the percent decline from the maximum to the minimum of the cumulative return index, from January 2 to April 2, 2020. The drawdown of a portfolio of variable annuity insurers is -51% during this period. This is a substantially larger drawdown than the S&P500 (-34%), the financial sector more broadly (-43%), and rivals the airline industry (-62%). Some of the most affected companies experienced a drawdown of -65% or more (e.g., AIG, Brighthouse, and Lincoln). While this apparent fragility may be concerning in general, the solvency of life insurance companies that safeguard a large share of long-term savings and insure health/mortality risks is particularly important during a pandemic.
It may be tempting to conclude that life insurers experienced large losses due to the high death toll of the coronavirus, but this is not necessarily the case, as annuities represent a large fraction of insurers’ liabilities and insurers and, in fact, profit from those contracts if the policyholders die unexpectedly early. Instead, the fragility is the result of various insurance products with that come with minimum return guarantees. The traditional role of life insurers is to insure idiosyncratic risk through products like life annuities, life insurance, and health insurance. With the secular decline of defined benefit pension plans and Social Security around the world, life insurers are increasingly taking on the role of insuring market risk through minimum return guarantees. In the US, life insurers sell retail financial products called variable annuities that package mutual funds with minimum return guarantees over long horizons. Variable annuities have become the largest category of life insurer liabilities, larger than traditional annuities and life insurance.
From the insurers’ perspective, minimum return guarantees are difficult to price and hedge because traded options have shorter maturity. Imperfect hedging leads to risk mismatch that stresses risk-based capital when the valuation of existing liabilities increases with a falling stock market, falling interest rates, or rising volatility.
The fragility is not new to the current crisis. During the 2008 financial crisis, many insurers including Aegon, Allianz, AXA, Delaware Life, John Hancock, and Voya suffered large increases in variable annuity liabilities ranging from 27% to 125% of total equity. Hartford was bailed out by the Troubled Asset Relief Program in June 2009 because of significant losses on their variable annuity business. Risk mismatch between general account assets and minimum return guarantees leads to negative duration and negative convexity for the overall balance sheet and poses a challenge for life insurers in the low interest rate environment after the financial crisis. As a consequence, the stock returns of US life insurers have significant negative exposure to long-term bond returns after the financial crisis.
The persistent low-rate environment in combination with declining interest rates, widening credit spreads, and increased volatility will be a challenge to the balance sheet of life insurers in the foreseeable future.
-
Share of Jobs That Can Be Done from Home by GDP

Building on previous work to determine how many US jobs can be performed at home, the authors produce new estimates for 86 other countries. Their analysis reveals a clear positive relationship between income levels and the shares of jobs that can be done from home. For example, while fewer than 25 percent of jobs in Mexico and Turkey could be performed at home, this share exceeds 40 percent in Sweden and the United Kingdom. The striking pattern suggests that developing economies and emerging markets may face an even greater challenge in continuing to work during periods of stringent social distancing.
The authors conduct their analysis by merging their classification of whether each 6-digit SOC (Standard Occupation Classification) can be done at home based on the US O*NET surveys with the 2008 edition of the international standard classification of occupations (ISCO) at the 2-digit level.
The figure plots the author’s measure of the share of jobs that can be done at home in each country against its per capita income. They compute the jobs share using the most recent employment data available from the International Labour Organization (ILO) after restricting attention to countries that report employment data for 2015 or later. The income measure is GDP per capita (at current prices and translated into international dollars using PPP exchange rates) in 2019, obtained from the International Monetary Fund. They note that their classification assesses the ability to perform a particular occupation from home based on US data and that the nature of an occupation likely varies across economies with different income levels.
-
Social Distancing Behavior and Political Polarization — Trump Vote Shares

Since the purpose of social distancing is to reduce the spread of a virus, in this case COVID-19, it matters greatly whether people believe in the need to take such precautions. If people infer lower risk from the same set of facts (e.g., population density, case counts and deaths), they may impose unnecessary health risks on others. Given the political divide in the US and how individuals consume news and information, the authors of this new research examine whether political partisanship affects the risk perceptions of individuals during the ongoing COVID-19 pandemic of 2020.
The authors use a number of measures to explore the effects of political partisanship on pandemic risk perceptions and, among other revealing insights (regarding, for example, pandemic-related internet searches), they find that while a higher incidence of confirmed COVID-19 cases results in a reduction in daily distance traveled, this effect is muted in counties that favored Donald Trump in the 2016 presidential election. For example, with a doubling of the number of confirmed COVID-19 cases in a county, the percent change in average daily change in distance traveled falls by 4.75 percentage points. However, for this same doubling in cases in a county, a one standard deviation increase in Trump voter share mutes this effect by 0.5 percentage points. Similar patterns are revealed when the authors examine the change in daily visits to non-essential businesses—residents in counties that favored Trump took more non-essential trips.
-
One of the provisions of the new stimulus bill is called Pandemic Unemployment Assistance, which will extend unemployment benefits to self-employed workers, including gig workers. This is very different from the response in the Great Recession, when UI was not extended to the self-employed. While todays’ provisions are not completely unprecedented—they are largely based on the 1974 Disaster Unemployment Act—nothing like this has ever happened at this scope and scale. The author’s new research on gig work provides some insight into how many gig workers might be newly eligible for new Unemployment Insurance.
In research examining administrative tax records, Koustas and his co-authors find that around 11% of the workforce engages in some type of gig work. If we define gig work as all independent contract/ freelancing, most gig work is not at all new (see Figure 1). While gig work has grown over the last few years, almost all of the recent growth has come from work mediated via new online platforms, the largest component of which are ridesharing platforms.
Around 60% of gig workers do this work as a “side-gig,” holding a “regular” job as a traditional employee. This share rises to 81% in the online platform economy. For these workers, unemployment benefits eligibility will almost certainly be determined based on their main, non-gig job. Still, millions of gig-only workers might now be eligible for benefits, represented by the yellow line in Figure 1 below.

While gig work in the online platform economy is concentrated in urban areas, the highest concentration of gig work is actually in more rural areas of the plains and Southern states, reaching 20% or more of all work in some counties (see Figure 2). These geographic patterns are important because implementation and eligibility verification for the new UI benefits will be left to the states.
As a result of the scale of the current crisis, as well as the lack of precedent and federal guidance on how to verify gig and self-employment income, state governments are likely to face novel challenges that will mean delays and barriers for workers eligible for benefits.

-
Lease Amendment for Rent Relief

With mandated shutdowns of most non-essential businesses, the great majority of small businesses in the United States are under serious economic strain. As rents become due, many will fail to make their payments, resulting in mass defaults. This is harmful to the tenants, our small business community, but also to the landlords who value and rely on these long-term relationships. In typical times, landlords would work with tenants to work out alternatives before moving forward with eviction proceedings. But these processes can be timely and expensive.
While the Coronavirus, Aid, Relief and Economic Security (CARES) Act offers forgivable loans to help small businesses cover their expenses, millions of businesses may not survive the time it takes for the transaction. A customizable, one-page lease addendum, drafted by the authors in coordination with legal and business input, provides a simple tool for appending to and modifying any commercial lease. The authors recommend that tenants pay only 10 percent of their usual rents during the relief period, with a further recommendation that 90 percent be deferred and 10 percent permanently forgiven by the landlord.
For more information visit: https://centerforrisc.org/lease
-
Characteristics of Workers Who Generally Cannot Work from Home

Absent a vaccine or widespread testing,[1] “social distancing,” which requires employees in many jobs to work from home, is the best policy option to reduce the spread of COVID-19. This suggests that returning to work will likely occur more slowly for jobs that require a large degree of proximity to other individuals, such as those who work in closely arranged cubicles. So, who are the workers who do not have the opportunity to work from home and, therefore, are at greater risk of infection?
Building on recent work that describes the type of jobs that allow for working at home[2] and merging multiple datasets, the authors of this new research compare the characteristics of individuals in various occupations who cannot work from home to those of workers in occupations that can work from home. Individuals in occupations that cannot be done from home are:
- economically more vulnerable,
- less likely to have a college degree,
- less likely to have health insurance,
- likely nonwhite,
- likely to work at a small firm,
- likely to rent, rather than own, their home,
- and more likely born outside the United States.
An understanding of how individuals vary across occupations, and the likely impact of such strategies as social distancing, is important for policymakers considering how to best target economic policies designed to assist workers.

[1] See related fact on this page and BFI White Paper in this series, “An SEIR and Infectious Disease Model with Testing and Conditional Quarantine”
[2] See related fact on this page and BFI White Paper in this series, “How Many Jobs Can Be Done At Home?” -
Average Daily Household Spending in 2020
In a new study, the authors use de-identified data from a non-profit Fintech to study how US household spending responded to the COVID-19 crisis. Households dramatically changed their spending as COVID-19 spread. As cases began to spread in late February, spending increased sharply, indicative of households stockpiling goods in anticipation of a higher level of home-production, an inability to visit retailers, or shortages. Total spending rose by approximately half between February 26 and March 11, when a national emergency was declared and as cases grew throughout the country. There is also an increase in credit card spending, which could indicate borrowing to stockpile goods. Between the imposition of a national emergency and many states and cities issuing shelter-in-place orders starting on March 17, there are elevated levels of grocery spending. These patterns continue through the month of March.
The authors use the rich dataset to characterize heterogeneity across spending categories, demographics, income groups and partisan affiliation. There are very sharp drops in restaurants, retail, air travel, and public transport in mid to late March. The decrease in spending was not consistent across all categories, e.g., grocery spending increased, as did food deliveries. Despite increases in some categories, total spending dropped by approximately 50%.
Men stockpile slightly less, and families with children stockpile more than other households. Younger households stockpile later than other households. There is little heterogeneity across income—although our sample is skewed toward lower income individuals. Cell phone records indicate differences in social distancing between political groups—individuals in states with more Trump voters were much more likely to move around in mid and late March. Republicans stockpiled more than Democrats, purchasing more on groceries in late February and early March. Republicans were spending more in retail shops and at restaurants in late March, which may reflect differences in beliefs about the epidemic’s threat, or differential risk exposure to the virus.
-
Welfare Effects of Closing Non-essential Businesses

Government officials around the world have ordered businesses shut and families to stay in their homes except for essential activities. This fact estimates the opportunity costs of lockdown relative to a normally functioning economy.
National income accountants have found that adding a nonwork day to the year reduces the year’s real GDP by about 0.1 percent. Adding a nonwork day to a quarter would therefore reduce the quarter’s unadjusted real GDP by about 0.4 percent. Extrapolating from this finding, removing all of the working days from a quarter is 62 or 63 times this, or 25 percent. In other words, if seasonally-adjusted GDP for 2020-Q2 would have been $5.5 trillion at a quarterly rate (see Table), then changing all of that quarter’s working days to the functional equivalent of a weekend or holiday would reduce the quarter’s GDP to $4.2 trillion. Applying the same approach to 2020-Q1, with a lockdown occurring for one-eighth of the quarter, 2020-Q1 real GDP (in 2020-Q2 prices) would be $5.4 trillion. The quarter-over-quarter growth rate of seasonally-adjusted real GDP would, expressed at annual rates, therefore be -10 percent in Q1 and -63 percent in Q2.
Bottom line: Given these and other facts,[1] while even negative 50 percent is an optimistic projection for the annualized growth rate of US GDP in 2020-Q2, (assuming nonessential businesses stay closed over that time), this large figure may understate the true effect, which could total nearly $10,000 per household per quarter.
[1] http://caseymulligan.blogspot.com/2020/03/the-economic-cost-of-shutting-down-non.html
-
Physicians & Surgeons — Surge Clinician-Shifts (Per Week Per 100k)

Epidemiological models predict that COVID-19 will generate extraordinary demand for medical care, raising questions about whether the US healthcare system has sufficient capital (ventilators and ICU beds) and labor (doctors, nurses and other healthcare workers) to provide needed care.[1] To gauge the surge capacity of the US healthcare workforce, the authors calculate how much additional care could be provided if clinicians increased their workloads to 60 hours per week.[2] They use data from the 2015-2017 American Community Survey, which surveys 1% of the US population each year, and records workers’ occupation and weekly hours.[3]
The table below shows national-level statistics, with a focus on three occupations: physicians, registered nurses, and respiratory therapists, who provide intubation and ventilation management for COVID-19 patients with breathing difficulties.[4] The US has 237 physicians per 100,000 people, who work the equivalent of 4.3 12-hour shifts per week, and thus provide 1,022 clinician-shifts per 100,000 people per week. If physicians increased their capacity to 60 hours, or five 12-hour shifts, per week, they could provide an additional 163 clinician-shifts, or 16% more care. Registered nurses provide a baseline of 2,111 clinician-shifts per 100,000 people per week. Because they work fewer hours at baseline, they could increase their capacity by an additional 1,276 clinician-shifts per 100,000 people or 60% by working five shifts per week. Respiratory therapists’ surge capacity is proportionally similar.

Surge capacity varies substantially by region. Physician surge capacity, measured in clinician-shifts per 100,000 people per week, is nearly twice as large in the Northeast as the Midwest or Deep South. Surge capacity for registered nurses is highest in the Midwest, and lowest in the Southwest. Respiratory therapist surge capacity is highest in the Great Plains and the South. The Southwest has relative low surge capacity for all three occupations.
Some clinicians have the training to care for COVID-19 patients. Others could be cross-trained to provide this care. Even clinicians who are not appropriate for cross-training can fill in for coworkers who have been shifted to COVID-19 care, as could retired workers who have training and experience but have higher COVID-19 mortality risk.[5] As some states have already started doing,[6] easing licensing restrictions can give hospitals the flexibility to better cope with this unprecedented spike in demand.


[1] Ferguson, Neil M., et al. March 16, 2020. “Impact of non-pharmaceutical interventions (NPIs) to reduce COVID-19 mortality and healthcare demand.” London: Imperial College COVID19 Response Team.
[2] The authors choose 60 hours because this is the average amount that physicians report working per week during the ages when they are in training. This training is notorious for requiring long hours, but these hours are apparently manageable for a period of months or a few years.
[3] The authors restrict their analysis to those working in hospitals and physicians’ offices, as these industries are most relevant for COVID-19 care.
[4] Data on additional occupations are shown in the Appendix.
[5] https://khn.org/news/help-wanted-retired-doctors-and-nurses-don-scrubs-again-in-coronavirus-fight/
[6] E.g., https://malegislature.gov/Bills/191/S2615 and http://www.op.nysed.gov/COVID-19Volunteers.html -
Share of Jobs That Can Be Done from Home
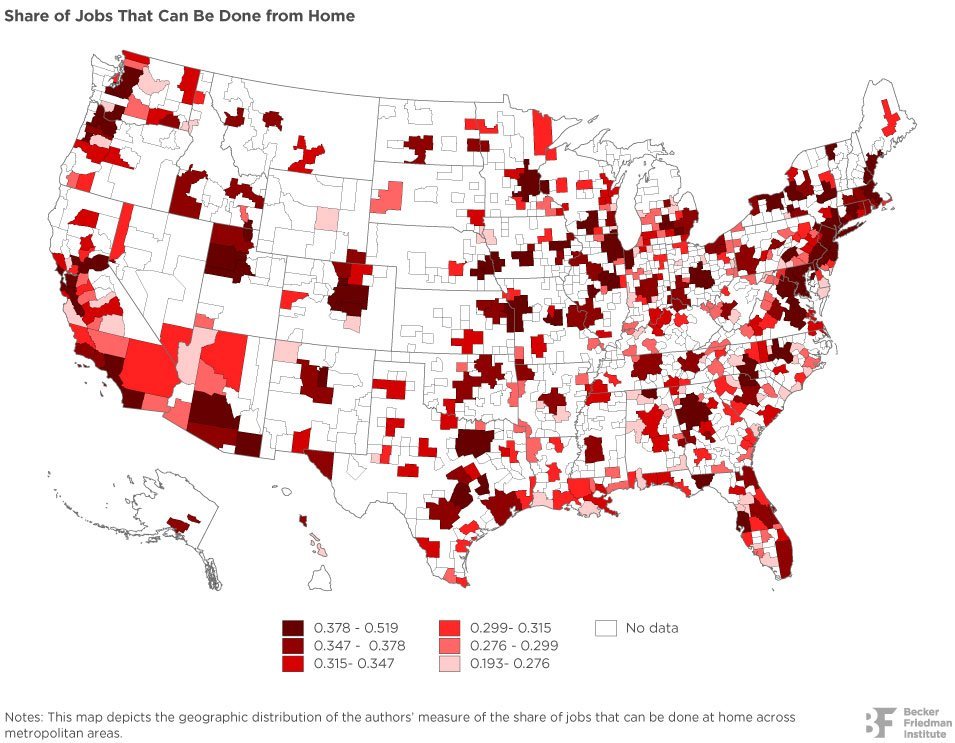
To evaluate the economic impact of “social distancing,” one must determine how many jobs can be performed at home, what share of total wages are paid to such jobs, and how the scope of working from home varies across cities and industries. By analyzing surveys[1] about the nature of people’s jobs, the authors classified whether that work could be performed at home. The authors then merged these job classifications with information from the Bureau of Labor Statistics on the prevalence of each occupation in the aggregate, as well as in particular metropolitan areas and industries.
This analysis reveals that 37% of US jobs can plausibly be performed at home. Assuming all occupations involve the same hours of work, these jobs account for 46% of all wages (occupations that can be performed at home generally earn more). As the accompanying map indicates, there is significant variation across cities. For example, 40% or more of jobs in San Francisco, San Jose, and Washington, DC, can be performed at home, compared with fewer than 30% in Fort Myers, Grand Rapids, and Las Vegas. There are also large differences across industries. A large majority of jobs in finance, corporate management, and professional and scientific services can be performed at home, whereas very few jobs in agriculture, hotels, or restaurants can do so.
[1] Feasibility of working from home was based on two surveys from the Occupational Information Network (O*NET).
-
What Share of Total US Employment is in Most Exposed Sectors?

A large number of businesses are mostly shut down for public health reasons, others are facing greatly diminished demand or are likely to shut down in the near future. Using data from the Bureau of Labor Statistics Current Employment statistics by detailed NAICS industry codes, we can measure how many people work in these most exposed businesses. Six of the most directly exposed sectors include: Restaurants and Bars, Travel and Transportation, Entertainment (e.g., casinos and amusement parks), Personal Services (e.g., dentists, daycare providers, barbers), other sensitive Retail (e.g., department stores and car dealers) and sensitive Manufacturing (e.g., aircraft and car manufacturing). In total, these sectors account for just over 20% of all US payroll employment, so shutdowns of these sectors on their own will lead to massive declines in employment. These will be offset partially by increased hiring in grocery stores, package delivery, etc., but this is unlikely to do much to dampen the blow.
This will likely get much worse if these shutdowns persist for multiple months and to the extent that they start to spill over substantially into other sectors like construction and broader manufacturing. Policy measures to reduce the depth and long-run effects of the recession should focus on 1) limiting the spread of the virus itself through direct health spending and allowing for effective social distancing, such as paid sick leave, expanded unemployment insurance and providing the tools for businesses with lots of in-person contact to idle; 2) providing liquidity so that households in shutdown industries can continue to shelter at home, eat, and not face devastating declines in their financial conditions. These policies will limit the long-run harm of the recession and also reduce the spillovers into less directly affected industries. Note that providing liquidity also helps with allowing for social distancing and the first policy goal.
Footnote: NAICS Classification: Restaurants and bars: 7223-7225. Travel and Transportation: 4811,4812, 4853, 4854, 4859, 4881,4883, 7211. Personal Services: 6212, 8121,8129. Entertainment: 7111, 7112, 7115, 7131, 7132, 7139. Other sensitive retail: 4411, 4412, 4421, 4422, 4481, 4482, 4483,4511,4512, 4522, 4531, 4532, 4539, 5322, 5323, 4243, 4413, 4543. Sensitive Manufacturing: 3352, 3361, 3362, 3363, 3364, 3366, 3371, 3372, 3379, 3399, 4231, 4232, 4239, 3132, 3141, 3149, 3152.
-

How can we understand today’s enormous increase in UI claims at the onset of the COVID-19 epidemic? Given how quickly the situation has moved we knew there would be a large increase in UI claims, whereas in a slower moving crisis, the weekly flows into UI slowly increase as the stock of UI claimants balloons. To put things in perspective we can go back to the Great Recession and accumulate UI claims in excess of what we would normally expect. The chart below shows that new UI claims in one week correspond to all new UI claims during the first six months of the Great Recession.

These statistics reflect public health policy aimed at slowing the spread of the disease. In terms of the labor market, if they also represent workers on temporary layoff, with their jobs kept intact and income support, we may see a V-shaped recovery. If, on the other hand, they represent workers that have now become truly unemployed, with their jobs terminated, and little income support, this will be a painful, slow, L-shaped recovery. As Ganong and Noel note elsewhere in these facts, UI claims may even undershoot the fraction of workers who would be eligible to claim.
-
Growth in Industrial Value-Added (NBS), Truck Flows among Provincial Capital Cities

On January 23, the Chinese government locked down the city of Wuhan (Hubei Province). In subsequent days, similar measures were taken in other cities in Hubei and throughout China. This note offers some preliminary gauge on the effect of the measures taken to protect public health on economic activity in China. We will make use of three data sources. First, some official data on industrial output already exists. Second, we make use of data on trucking flows to measure the flow of goods across China. Third, Baidu Map data allow us to estimate the effect on services and worker movements within China.
We begin with official data provided by China’s National Bureau of Statistics (NBS). The most recent data (as of March 23, 2020) is from February 2020. Figure 1 shows that industrial value added fell by 4.3% and 25.9% in January and February of 2020 on a year-on-year basis. If the counterfactual growth in absence of the epidemic is 5.7%, the average growth in 2019, the slump would be even more dramatic.
An alternative data on industrial output is data on shipment of goods across Chinese cities. We have data from a private trucking company that provides logistical services to truck drivers. This company, G7, has real-time GPS data from two million trucks, accounting for about 10 percent of all trucks operating in China. We aggregated the movement of trucks in and out of a provincial capital by day. Figure 2 plots the daily truck flows between provincial capital cities, with the beginning day of the year normalized to one. The decline of truck flows before Wuhan lockdown captures the slowdown associated with the coming Chinese New Year. Strikingly, the truck data suggest that goods flows between Wuhan and the other provincial capital cities remained at a very low level and did not recover at all since the lockdown.

The next data we show are flows of people within and between cities. Here, we use indices of movements of people provided by Baidu. This data is based on “location-based services” (LBS) in Baidu Map. Figure 3 plots within-city travel intensity, with the beginning day of the year normalized to one. Panel A and B plot the data for 2019 and 2020, respectively. The red bar in Panel A marks the 2019 Chinese New Year. The black bar in Panel B marks Wuhan lockdown, which is two days before the 2020 Chinese New Year and exactly precedes the free fall of within-city travels in Hubei. The index dropped by more than half within a three-day window and remained low for six weeks, only to pick up recently until the mid-March. The indices outside Hubei were picking up more rapidly and have almost reached the level in early January.
The movement of people across Chinese cities was more severely affected, as shown in Figure 4. The travels to/from cities in Hubei were nearly frozen. The cross-city travels that do not involve Hubei cities also experienced sharp declines, though to a lesser extent than those involving Hubei cities. In mid-March, the cross-city travels outside Hubei have fully recovered to its early January level.
In sum, the economic impact of lockdown on China is large, severe, and perhaps still mounting despite various massive economic and financial policies that are rolled out by top authorities in Beijing in a timely fashion[1]. China is facing a daunting challenge for its economic recovery at this point, especially because the deteriorating pandemic situation across the globe is bringing an almost complete halt to the export sector in China, and could make it difficult for Chinese firms to access critical inputs provided by firms outside of China.
[1] View related white paper, “Dealing with a Liquidity Crisis: Economic and Financial Policies in China during the Coronavirus Outbreak.”
-
Flight to T-Bills/Cash, Dollar is King
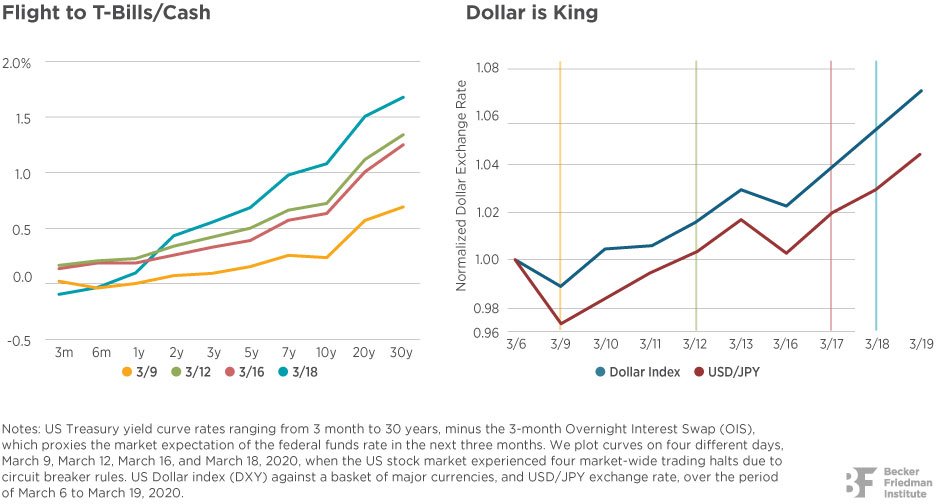
When the market is calm, the term structure of the Treasury yield curve tends to be upward sloping, as investors expect to be paid more when lending in the longer-term. But on March 9, when the first market-wide halt was triggered by the coronavirus outbreak, the term structure was greatly flattened as investors responded to stock market turmoil by turning to long-term government bonds. During the second and third market-wide halts on March 12 and March 16, as the liquidity crisis was looming, investors started scrambling for cash, i.e., the government debt with the shortest maturity. As a result, short-term Treasury Bills (T-Bills) that can be quickly converted to cash became highly favored by investors, raising their prices relative to long-term treasuries and bending the entire yield curve upward sloping again.[1] This flight to T-Bills also explains the recent striking fall of stocks, commodities, and long-term bonds in the same time.
The situation worsened even more on March 18 when the stock market halted for the fourth time in this sequel, strengthening the upward yield curve. However, the upward slope in this dire situation is driven by the surging demand of US currency from market participants–ranging from companies, funds, or sovereigns–potentially to pay off their US dollar denominated debts and other contractual obligations. This dramatic increase in demand for US currency is reflected in Figure 2, which plots the soaring dollar index (DXY) against other major currencies. Note, USD/JPY rises too, even though Japan has been widely appraised for its success of containing the virus during this time. This is behind the Federal Reserve’s recent aggressive expansion of its dollar swap lines with several major central banks.
[1] We have taken the 3-month OIS spread out from the entire yield curve to eliminate any mechanical level shift caused by the (expected or realized) federal funds rate movement on that day. (Indeed, the federal funds rate was cut on March 15.) Also, the upward sloping is not due to rising expectation of inflation; during this period the breakeven inflation rate (a market-based measure of expected inflation, the spread between nominal bonds and inflation-linked bonds say TIPS) goes down slightly.
-
The Current Pandemic and Policy Responses are Driving Market Volatility

As the novel coronavirus (COVID-19) spread around the world, equities plummeted and market volatility rocketed upwards. In the United States, recent volatility levels rival or surpass those last seen in October 1987 and December 2008 and during the Great Depression, raising two key questions: 1) what is the role of COVID-19 developments in driving market volatility, and 2) how does this episode compare with historical pandemics, including the devastating Spanish Flu of 1918-20?
Employing automated and human readings of newspaper articles dating to 1985, the authors find no other infectious disease outbreak that had more than a minimal effect on US stock market volatility. Reviewing newspapers back to 1900, the authors find no contemporary newspaper account that attributes a large daily market move to pandemic-related developments, including the devastating Spanish Flu pandemic, which killed an estimated 2% of the world’s population. In striking contrast, news related to COVID-19 developments is overwhelmingly the dominant driver of large daily US stock market moves since February 24, 2020.
While the severity of COVID-19 explains some of the market’s volatile response, the authors find this answer incomplete, especially since similar—or worse—fatality rates 100 years ago had comparatively modest effects on markets. The authors offer three additional explanations:
- Information about pandemics is richer and is relayed much more rapidly today.
- The modern economy is more interconnected, including the commonplace nature of long-distance travel, geographically expansive supply chains, and the ubiquity of just-in-time inventory systems that are highly vulnerable to supply disruptions
- And behavioral and policy reactions meant to contain spread of the novel coronavirus, including adoption of social distancing, are more widespread and extensive than past efforts, and have a more potent effect on the economy.
-
Approximate Overhead Costs by Industry for Private Firms

The graph displays an estimate of overhead costs ($1.16 trillion total) for all non-financial S-corporations based on aggregate data from tax returns. Overhead costs are meant to include required expenses for firms, like interest, rents, utilities, maintenance, and so on. They do not include payments to workers, nor profits for shareholders, nor new capital expenditures.
Three points deserve note. First, overhead costs are important for private firms (approximately 14% of total revenues or 38% of gross profits). Second, we can estimate such costs relatively easily using information from past tax returns, which points toward feasible policy solutions designed to help firms cover these costs quickly during the coronavirus crisis. Third, aggregate overhead costs are especially important in retail and wholesale trade. These industries have many small private firms likely to be hardest hit by the crisis.
[1]Source data are aggregates from the SOI corporate sample for the tax year 2014, aged to 2018 using the growth of nominal GDP. The year 2018 is the latest year for which tax returns would be readily available to the IRS to implement a policy.
[2] S-corporations likely account for between 1/4 and 1/3 of all overhead among non-financial private business, which includes partnerships, sole proprietorships, and private C-corporations.
-
Survey of Business Uncertainty (March 9 - 20, 2020)

While the effect of the COVID-19 virus on financial markets has been apparent for weeks—US equities fell 30% from February 21 to March 20—we are still months away from realizing the full economic effect. However, the recent Survey of Business Uncertainty (SBU)[1] portends a sharp drop in business activity in 2020. Moreover, business pessimism grew from March 9 to March 20, while the survey was in the field.
When asked directly about the impact of coronavirus developments in mid March, firms see a 6.5 percent negative hit to their sales revenues in 2020. Comparing what firms say about their overall sales outlook in March to what they said in February yields a very similar drop in expected sales revenue. Further, firms’ uncertainty about their own sales growth over the next year rose 44 percent from February to March.
[1]In partnership with Steven Davis of the University of Chicago Booth School of Business and Nicholas Bloom of Stanford University, the Federal Reserve Bank of Atlanta has created the Atlanta Fed/Chicago Booth/Stanford Survey of Business Uncertainty (SBU). This innovative panel survey measures the one-year-ahead expectations and uncertainties that firms have about their own employment, capital investment, and sales. The sample covers all regions of the U.S. economy, every industry sector except agriculture and government, and a broad range of firm sizes.
-
Receipt of Unemployment Insurance by Unemployed Workers

Most unemployed workers in the United States do not usually receive unemployment insurance (UI). In 2019, only 1 in 4 unemployed workers received UI benefits, because of eligibility rules and barriers to program participation. In normal times, receipt of UI benefits requires: 1) proof that the worker was laid off because of changes in labor demand (“good cause”), 2) proof that the worker is searching for a job, and (3) a sufficient work history. In addition, there are usually several administrative hurdles that laid-off workers need to leap to claim benefits.
Although these requirements lead to low UI recipiency throughout the US, some states’ UI systems are particularly ill-equipped to address the coming increase in layoffs. In North Carolina, for example, only 1 in 10 unemployed workers receives UI benefits. However, no state is well-prepared. Even in the states that are doing relatively well, like Pennsylvania, fewer than 1 in 2 unemployed workers receive UI benefits.
-
Change in Electricity Consumption in Italy Since February 21

With Americans largely self-isolating amid concerns about COVID-19, some of the hardest-hit areas are already seeing electricity demand begin to weaken. It is useful to review what has happened to power demand in Italy, which some say is about 11 days ahead of the US trajectory of the virus. Compiling regional grid data and adjusting for weather changes reveals that power demand has plunged in Italy since the middle of February.
On Friday, February 21, life was largely going about as normal in Italy. The following day, the Italian government began to institute quarantine measures. By Monday, power demand began to slow. Since a national lock-down on March 10, national power demand had fallen over 28% compared to demand just prior to the quarantine measures.
Power demand could be a real-time indicator of the more widespread impacts on the Italian economy. Also, what is happening in Italy could point to what the United States could expect in the coming weeks as states issue tighter restrictions on daily life. When there is a sharp shock to the economy, other indicators like employment may lag in reflecting the impact. This is because laying off workers is often seen as a last resort as companies start by taking other measures like ramping down production or adjusting maintenance schedules. Conversely, electricity demand shows the more immediate change and is a broad measure of economic activity. This was on display during the last recession in the United States. US power demand began to fall a month before the official start date of the recession according to the National Bureau of Economic Research—a date that was determined after an additional year of data had been collected. As policymakers today are considering which countermeasures may be in order to buffer the economic effects of coronavirus, a real-time indicator of the economy’s strength is of the utmost importance.
-
Counterfactuals with Testing and Quarantine Measures

We extend the baseline SEIR infectious disease epidemiology model to understand the potential role of broad based testing in guiding government quarantine policies. Reducing quarantine measures by themselves would increase mortality. However, our framework demonstrates that randomly testing asymptomatic individuals and then targeting quarantine measures to those who test positive to COVID-19 can deliver the same mortality as severe quarantine measures, with a less devastating impact on the economy.
-
Benefits of Social Distancing in the US are Projected to Exceed $8 Trillion

As the United States and the rest of the world grapple with COVID-19, the most reliable policy response seems to be social distancing, which itself imposes substantial costs on economies and people’s well-being. Indeed, people have begun to question whether the costs of social distancing exceed its benefits and are therefore too great. Here, we estimate the economic benefits of social distancing due to reducing mortality rates.
Panel A is derived from Ferguson et al. (2020) and reports the projected daily deaths in the United States due to COVID-19, including the impacts of overcrowding. It is apparent that the moderate social distancing scenario (roughly consistent with current US policy) is projected to greatly reduce the number of deaths, relative to the “no policy” scenario. The period where the daily number of deaths under the distancing scenario exceeds the “no policy” number of deaths is because of the lower rates of immunity in the population due to distancing. After September 1, the number of daily deaths in the two scenarios is equal. In total, these projections indicate that the moderate social distancing scenario will save 1.1 million lives by avoiding new infections and an additional 600,000 lives by avoiding overcrowding of hospital intensive care units.
Panel B shows the monetized benefits of saving these lives, which total $7.9 trillion, or roughly $60,000 per US household. About 90% of the monetized benefits are projected to accrue to people age 50 or older. Importantly, the benefits we compute are in the trillions of dollars because they capture the total value Americans place on remaining alive: not just the income they earn, but also the value they place on leisure, spending time with friends and family, and all other activities. Even so, the $7.9 trillion is likely an underestimate, because it does not account for social distancing’s impact on reducing uncertainty about mortality impacts, the potential for reducing morbidity rates, and improving quality of medical care for non-COVID-19 medical problems.
-

When trade costs are low, creative destruction among firms increases, jobs are reallocated accordingly, and productivity increases. Analyzing trade patterns between the United States and Canada before and after the Canada-US Free Trade Agreement (CUSFTA) of 1988, the authors describe key facts about the flow of jobs across firms, and how these flows are affected by trade policy. These facts can be distilled to two key points:
- Large job flows. The average job creation and destruction rate in manufacturing over five-year periods (from 1973-2012) is about 30 percent in Canada. The average job creation rate in US manufacturing is also about 30 percent (1973-2012), and the average job destruction rate in the US is about 5 percentage points higher. The large rates of job creation and destruction suggest that an important part of economics is when firms innovate on products of other firms. Innovating firms then gain jobs, while the firms whose products are taken over lose jobs.
- Trade is a big driver of creative destruction. This is particularly evident in Canada, which has a much smaller economy than the US and, likewise, shifts in trade policy have larger aggregate impacts. For example, Table 1 shows job creation and destruction rates in Canada before and after CUSTA. Job losses increased from about 25 percent to 32 percent, but job gains from exports doubled from about 9 percent to 18 percent. In the US, the job destruction rate increased about 6 percentage points after CUSTA (Table 2), but the US was also impacted by increased imports from China during that period, so these results cannot be attributed primarily to CUSTA. Also, all of the US job destruction was driven by large firms. Finally, productivity improves as trade grows and innovations occur.
One important implication of this research is that policymakers should consider the role of innovation—and the flow of cross-border ideas—when conducting trade policy.

-
ChartFigure 1: The Evolution of Average Employment Relative to VC Funding Date

Note: The observations are relative to average employment (normalized to 1) for VC-funded startups in the year of first VC funding, t=0.
Not every new business venture hits the big time; indeed, most begin small and stay small through their lifecycle. Critically, for the aggregate economy, most new firms also do not make breakthrough innovations that spur productivity growth beyond their business. What sets the game-changers apart from the pack? A number of factors can put a new venture on a path to growth, including the presence of a patent or a trademark, R&D activity, and initial firm size.
However, this research adds another factor to the mix: It turns out that venture capital (VC) backing during the early stages of a start-up is a key ingredient of firm success. More than that, the authors find that such firms are also key contributors to aggregate innovation and productivity growth; that is, these individual firms introduce technological advances that not only benefit the firms’ bottom line, but that also disperse into the broader economy.
ChartFigure 2: The Evolution of the Average Quality-Adjusted Patent Stock Relative to VC Funding Date
Note: The observations are relative to the average patent stock (normalized to 1) for VC-funded firms in the year of VC funding, t=0.
Following are the key empirical observations of this research:
- Like all start-ups, VC-backed firms are subject to the slings and arrows confronting fledgling businesses—many fail and many remain small. However, VC-backed firms are much more likely to grow and attain “superstar” status than non-VC-backed firms. Further, such firms are increasingly dominating markets within their industries.
- The second and third points emphasize that the relationship between a VC and an entrepreneur matters—a lot. And those relationships do not begin randomly. It turns out that VCs select the most promising startups to support. The authors’ empirical analysis shows strong evidence of assortative matching between entrepreneurs and financiers (including banks and others); those firms with promising innovation and growth prospects are more typically funded by VCs.
- Further, not all VCs are created equal: those with more experience and with higher funding capabilities tend to ensure greater success for start-ups. Again, those start-ups backed by more experienced VCs engage, on average, in more innovative techniques. Moreover, as measured by patent citations, these more innovative technologies have the largest positive impact on the rest of the economy.
The authors’ empirical analysis revealed the following results:
- Employment at VC-funded firms grows, on average, by about 475 percent over the time the VC is involved with the firm, compared with employment growth of about 230 percent for non-VC-funded firms.
- Similarly, VC-funded firms experience much higher growth in patent stock: VC-funded firms’ patent stock grows by about 1,100 percent vs. about 440 percent for non-VC-funded firms.
-

The US looks very different now from 1965, in ways that make having a single Medicare program for everyone less efficient and less financially sustainable.
- First, medical technology has advanced by leaps, improving health and extending lives, but at mounting cost. For example, a heart attack that would have killed a patient in 1965 can now be successfully treated, but with an average hospital stay costing $20,000. While rich and poor could thus afford similar health care in 1965 because treatment was simpler and less expensive, the cost of providing everyone with all available treatment has skyrocketed as medical technology has evolved.
- Second, while top tax rates have fallen since the 1960s, average overall marginal tax rates have increased. These higher marginal tax rates come at a cost that goes beyond the actual revenues raised: they change the decisions and investments made throughout the economy, exerting a drag on economic activity (dubbed “deadweight loss”). This means the economic toll of financing new health benefits has become much larger.
- Finally, income inequality has risen substantially, and people with different incomes may want to devote a different share of resources to health care. Higher income households might opt for a generous, comprehensive benefit—but that would eat up an enormous share of overall resources available to lower income households. This raises the social cost of having a single, uniform plan. Forcing a generous plan on low-income households would make them worse off than a combination of a less generous plan with more generous other social insurance programs, while forcing a more basic plan on high-income households would prevent them from spending resources on health care that they value, and might in fact slow the development of new, life-saving medical technologies.
With these trends likely to continue, covering everyone with a uniform generous insurance plan will be increasingly challenging. An alternative would be to provide a more basic benefit to everyone—one with good financial protection and coverage for services with substantial health benefits, but with limited or no coverage for expensive, lower-value services. Higher income people could pay to add on coverage of those lower-value services.
-

In a healthy market economy, new businesses form every year and others fail. This business dynamism ensures that resources, including labor, are allocated to their most efficient use. Since 1980, though, and especially since 2000, business dynamism in the US has been declining.
There is currently a heated debate about the impact of market concentration and declining business dynamism on the US economy, and whether the two are related. This research finds that the key consideration in resolving this question is the degree of competition within markets, and the relative position of leading and following firms. Of the various factors that shape those competitive relationships and influence the level of business dynamism, the one with the greatest impact is knowledge diffusion, or the degree to which following firms learn from leaders. This phenomenon accounts for at least half of decrease in business dynamism.
While the authors refrain from offering explicit policy guidance and make a case for further research, they do discuss the strategic use of patents since 2000, which may be a restraining influence on knowledge diffusion. For example, in 1980, 35 percent of patents were produced by the largest 1 percent of the firms, by the 2010s it was 60 percent. Also, the secondary market for patents has evolved to favor large firms, with the top 1 percent buying 65 percent of patents in the resale market, as opposed to 30 percent in 1980. Some of those transactions fit the description of killer acquisitions, whereby large firms buy a patent not to incorporate its new technology, but to put the patent on a shelf, thus squelching the patent’s competitive benefits. If there is a role for policymakers in addressing the decline in business dynamism, it likely does not entail traditional issues like tax rates and subsidies, but necessitates a close examination of the secondary market for patents.
-
ChartFigure 1: The Spatial Distribution of Employment at Foreign Firms

Notes: The two figures display spatial variation in employment at foreign-owned firms observed in the tax data for the workers sample of interest. In the first figure, the share of workers employed at foreign-owned firms is plotted in 2001 for each commuting zone. In the second figure, changes from 2001 to 2015 in the share of employment at foreign-owned firms are plotted by commuting zone.
Local governments often try to lure foreign multinationals to their cities and counties. Employing a novel dataset, the authors investigate the direct effects that foreign multinationals have on their own employees, as well as the indirect effects that these firms have on local businesses and their employees.
Direct Effects: In total, the amount of wages paid by foreign multinationals is 25 percent greater than domestic firms in the same industry and region. However, this difference may reflect that foreign multinationals tend to hire high-skilled workers. The authors study workers who move across firms in their data to show that the same worker earns 7% more in wages when moving from a domestic firm to a foreign multinational. In the aggregate, this 7% raise is not trivial— roughly $34 billion annually in US wages, or about 0.6% of all private sector wages, are paid as a premium by foreign multinationals.
Indirect Effects: What happens to domestic workers and firms when foreign multinationals enter a commuting zone? The broad answer is that employment and wages increase, and there is overall value added (sales minus the cost of goods sold) for private firms. These positive effects are highest for firms in the tradable goods sector and among those domestic firms with more than 100 employees.
The accompanying maps in this Economic Fact show the distribution of foreign multinationals in the US in 2001 and where their employment grew over time (Figure 1). An accompanying figure presents the wage gains when moving from the average domestic firm to the average foreign multinational by country of foreign ownership (Figure 2).
-
Since 1970, lower-income households have tended to live downtown more than middle-income households, which typically live in the suburbs. Also, on average, as households gain more income, they are more inclined to live downtown. This has long been the case and is illustrated by the U-shaped curve in Figure 1. However, as the blue line in Figure 1 reveals, something new has occurred over time that has made that U shape more pronounced: There are more wealthy households, and they are moving downtown.
What are the effects of this phenomenon? To answer that question, the authors built a model that explains spatial sorting (or where people choose to live) within a city. This model has two key features: households make residential choices based on their income, and neighborhoods change as those households rearrange themselves. For example, wealthier households not only make choices based on public amenities (like parks and schools), but also proximity to private amenities (like restaurants and entertainment venues).
ChartFigure 1: Downtown Residential Income Propensity
Note: Table uses Census data on family income
If wealthier people move to a particular neighborhood in growing numbers, the quality of both types of amenities are likely to improve—public amenities because of increased property tax revenue, and private amenities because households have more to spend. Regarding private amenities, developers in the authors’ model build neighborhoods based on household demands, which results in differentiated neighborhoods from which households can choose to live. Households weigh the cost of living (housing, taxes, commuting, for example), with the benefits, including public and private amenities. If they value high-end restaurants and proximity to the opera hall, and they can afford the relatively higher cost of living, then households in this model will choose to live in those neighborhoods. Likewise, households that value such amenities differently will choose to live in other neighborhoods.
When it comes to the question of whether and how rising incomes of the rich can explain neighborhood change in downtowns between 1990 and 2014, the model offers a clear answer: The rising rich are primarily responsible for the changing sorting patterns by income. An influx of high-income households increases the relative demand for high-quality neighborhoods, which puts upward pressure on housing prices. This upward pressure on housing prices affects other downtown neighborhoods, presenting poorer households (who are mostly renters) with a choice: Stay in their neighborhoods and pay higher rent for amenities that they don’t necessarily value, or move to the suburbs. The rich not only get richer, but there are more of them and they enjoy a better lifestyle, while the poor, who find their income stretched by rising housing costs or who are forced to move, experience a drop in well-being.
-
The promise of the American dream is about the possibility of upward mobility; namely, that anyone, regardless of where they were born and what class they were born into, can achieve success on their own terms. Together with the recent dramatic rise of income inequality, US cities have experienced a steady increase in residential segregation by income that challenges this ideal.
This research focuses on the interconnection between inequality and residential segregation and the work of Raj Chetty and Nathaniel Hendren, who have estimated the effects of exposures to better neighborhoods on children’s future earnings. Fogli and Guerrieri use these micro estimates to study the macroeconomic implications of these neighborhood effects. They show that residential segregation significantly amplifies the increase in inequality in an economy where technological progress increases the skill premium.
ChartFigure 1: Inequality and Segregation across US Metros
To determine this result, the authors calibrate their model using salient features of the US economy in 1980 and the micro estimates of neighborhood exposure effects. Then they study the response of the economy to a “skill-biased technical change shock,” that is, a change in technology that increases the productivity of high-skilled jobs, and, hence, increases the earnings of the more and better educated workers. This is what happened in the US economy during the 1980s, and is considered one of the primary reasons for the widening income gap in following decades.
ChartFigure 2: Inequality—Counterfactual with Random Relocation
Note: This figure compares the response of inequality to the skill premium shock in the baseline model (yellow) to the response of the economy when families are randomly re-located between the two neighborhoods every period after the shock (light yellow). The figure shows that segregation contributes to 18% of the increase in inequality one period after the shock, that is, between 1980 and 1990, and to 28% of the increase in inequality over the whole period between 1980 and 2010.
The main contribution of this research is to quantify how much of the subsequent increase in inequality is due to the presence of neighborhood effects and the resulting residential segregation. To this end, the authors compare the response of the benchmark model to the response that would arise if families were randomly re-located across neighborhoods and the segregation channel was muted. The authors show sizeable results: segregation contributed to 28 percent of the increase in inequality in response to skill-biased technical changes between 1980 and 2010. The more that skill premia drive disparity in wages, the more certain neighborhoods will continue to gain an advantage, as children in those neighborhoods are better positioned to learn, adapt, and earn more than children in poorer neighborhoods. Skill premia act like a widening wedge, driving future generations of rich and poor children further apart.
-
ChartFigure 1: Extensive vs. Intensive Margin Growth of Top Firms

Note: The left panel shows non-parametric regression of ∆ log # of MSAs, Counties or Establishments of top 10% firms relative to all firms on ∆ log employment share of top 10% firms, both from 1977-2013. The thin solid line is a 45° line. The right panel shows non-parametric regression of ∆ log employment per MSA, County or Establishment of top 10% firms relative to all firms on ∆ log employment share of top 10% firms, both from 1977-2013.
In recent decades, spurred in part by developments in information and communication technologies (ICT), along with important advances in management practices, the efficiencies long present in typical manufacturing sectors have emerged within wholesale, retail, and service (or non-traded) industries. This phenomenon has driven the development of efficiencies across many nontraded sectors. Firms have incorporated new methods that have allowed them to deliver similar products across space. However, as this research reveals, while some of these firms have grown to dominate particular sectors in terms of employment, their share of employment in the overall economy has remained stable.
The authors reveal the five following facts:
- Rising concentration within sectors is only evident among top firms in three industries: services, wholesale, and retail, where employment share among the top 14 percent of firms increased from 67% to 73% between 1977 and 2013, and not in such sectors as manufacturing, where concentration has actually decreased.
- Concentration is driven by expansion into new local markets, and leads to decreasing employment per establishment among top firms.
- While employment per establishment may fall, total employment rises substantially in industries with rising concentration, even among smaller firms. Technological and managerial advances, in other words, are not preventing competition but are rather intensifying its effects.
- This new industrial revolution has driven increasing specialization among the top firms in non-traded sectors, meaning that while these firms are focusing on certain industries, they are also leaving others.
- Finally, while the growth of such firms is increasing concentration in terms of employment within sectors, it is not resulting in similar concentration across the aggregate economy.
This last fact is key, especially given the recent focus and concern about the rise of so-called “superstar” firms. Many fear that these firms, which have achieved relative dominance in certain sectors, also have an outsized influence on the total economy. However, this work rebuts that view. Essentially, while this growth has led to increased concentration within certain sectors, there is no change in concentration among the broader economy’s top firms.
-
To address the questions of how to better inform potential aid recipients of program benefits, and whether assistance programs are effective, the authors examined the impact of various interventions on the number and type of eligible elderly Pennsylvania individuals who enroll in SNAP, the only social safety net program that is virtually universally available to low-income households.

The authors randomly placed 60,000 individuals aged 60 and over in three equally sized groups: an information only treatment, an information plus assistance treatment, and a status quo control group, to find the following:
1. Information alone increases enrollment, while information plus assistance is even more successful, but at a higher per enrollee cost. The information only group applied at a rate of 11 percentage points (at $20 per enrollee), with the information plus assistance treatment at 18 percentage points ($60), while the status quo control group was at just 6 percentage points.
2. Information decreases targeting. Marginal applicants and enrollees from either intervention are less needy than the average enrollees in the control group. The average monthly SNAP benefit (which declines with net income) is 20% to 30% lower among enrollees in either intervention arm relative to enrollees in the control group. Additionally, relative to the control group, applicants and enrollees in either intervention group are in better health, more likely white, and more likely have English as their primary language. Importantly, the 70 percent of individuals who did not respond to the interventions and remained largely unenrolled were likely more needy, suggesting the necessity for new and differently targeted interventions.
For policymakers, the main lesson is simple yet profound: information matters. Individuals’ willingness to apply for benefit programs depends in large part on whether they have accurate beliefs about expected benefits; also, different types of people may have varying sets of misperceptions. Getting information to possible recipients increases program take-up significantly, but information plus assistance with applications is even more effective. While these results are reflective of intervention programs for SNAP recipients among elderly Pennsylvania, they likely hold for other programs and among other possible recipients throughout the country.
-
Following the late-2017 announcement of tariffs on all washers imported to the United States, prices increased by about 12 percent in the first half of 2018 compared to a control group of other appliances. In addition, prices for dryers—often purchased in tandem with washing machines—also rose by about 12 percent, even though dryers were not subject to a tariff. On the one hand, these price increases were unsurprising given the tariff announcement. On the other hand, washers had been the subject of multiple import restrictions since 2012 and the price of this ubiquitous household appliance had actually declined over the ensuing years.
The authors’ careful analysis of the washer and dryer markets since 2012, including descriptions of “country-hopping” by manufacturers to avoid tariffs, offers insights for other sectors. Tariffs increase the cost of doing business, which often leads to increased prices for intermediate goods (those used in production) and final goods (those purchased by consumers and businesses). However, tracing the impact of a tariff through the production and delivery of a particular good is difficult; the effort is often inhibited by incomplete or private data that companies hold close. The case of washing machines, though, offers a clear view on the impact of global tariffs for a particular product: consumers are the losers. Indeed, as this research reveals, complementary goods—in this case, dryers—can also be affected. However, when single-product tariffs are applied to individual countries, production may shift to another country and could actually lower production costs and, thus, prices for consumers.
-
More than 6 percent of working age adults receive SSDI or SSI disability payments; that aggregate number has grown steadily over the last 30 years, roughly tripling to 10 million individuals.1 Given the size and growth of this demographic, it is imperative that policymakers understand the impact of disability programs and the degree to which they influence recipients’ financial standing and quality of life. For example, the authors cite anecdotal evidence that shows how some landlords prefer SSDI/SSI recipients because of their steady source of income, and how such income proves more reliable for some recipients than most available jobs.

But anecdotes and theoretical assumptions are not enough to assess whether these programs are actually operating as intended. To address this evidence gap, the authors constructed what they believe is the first quasi-experimental study of the effects of US disability programs on outcomes that look beyond labor supply and mortality data. The authors built a new dataset that links administrative records from the SSDI and SSI programs to records on bankruptcy, foreclosure, eviction, home purchases, and home sales. In doing so, they present a first look at recipients’ financial well-being. These disruptive financial events occur irregularly but they have an outsized negative impact on recipients’ financial status and give key insights into fluctuations in recipients’ consumption.
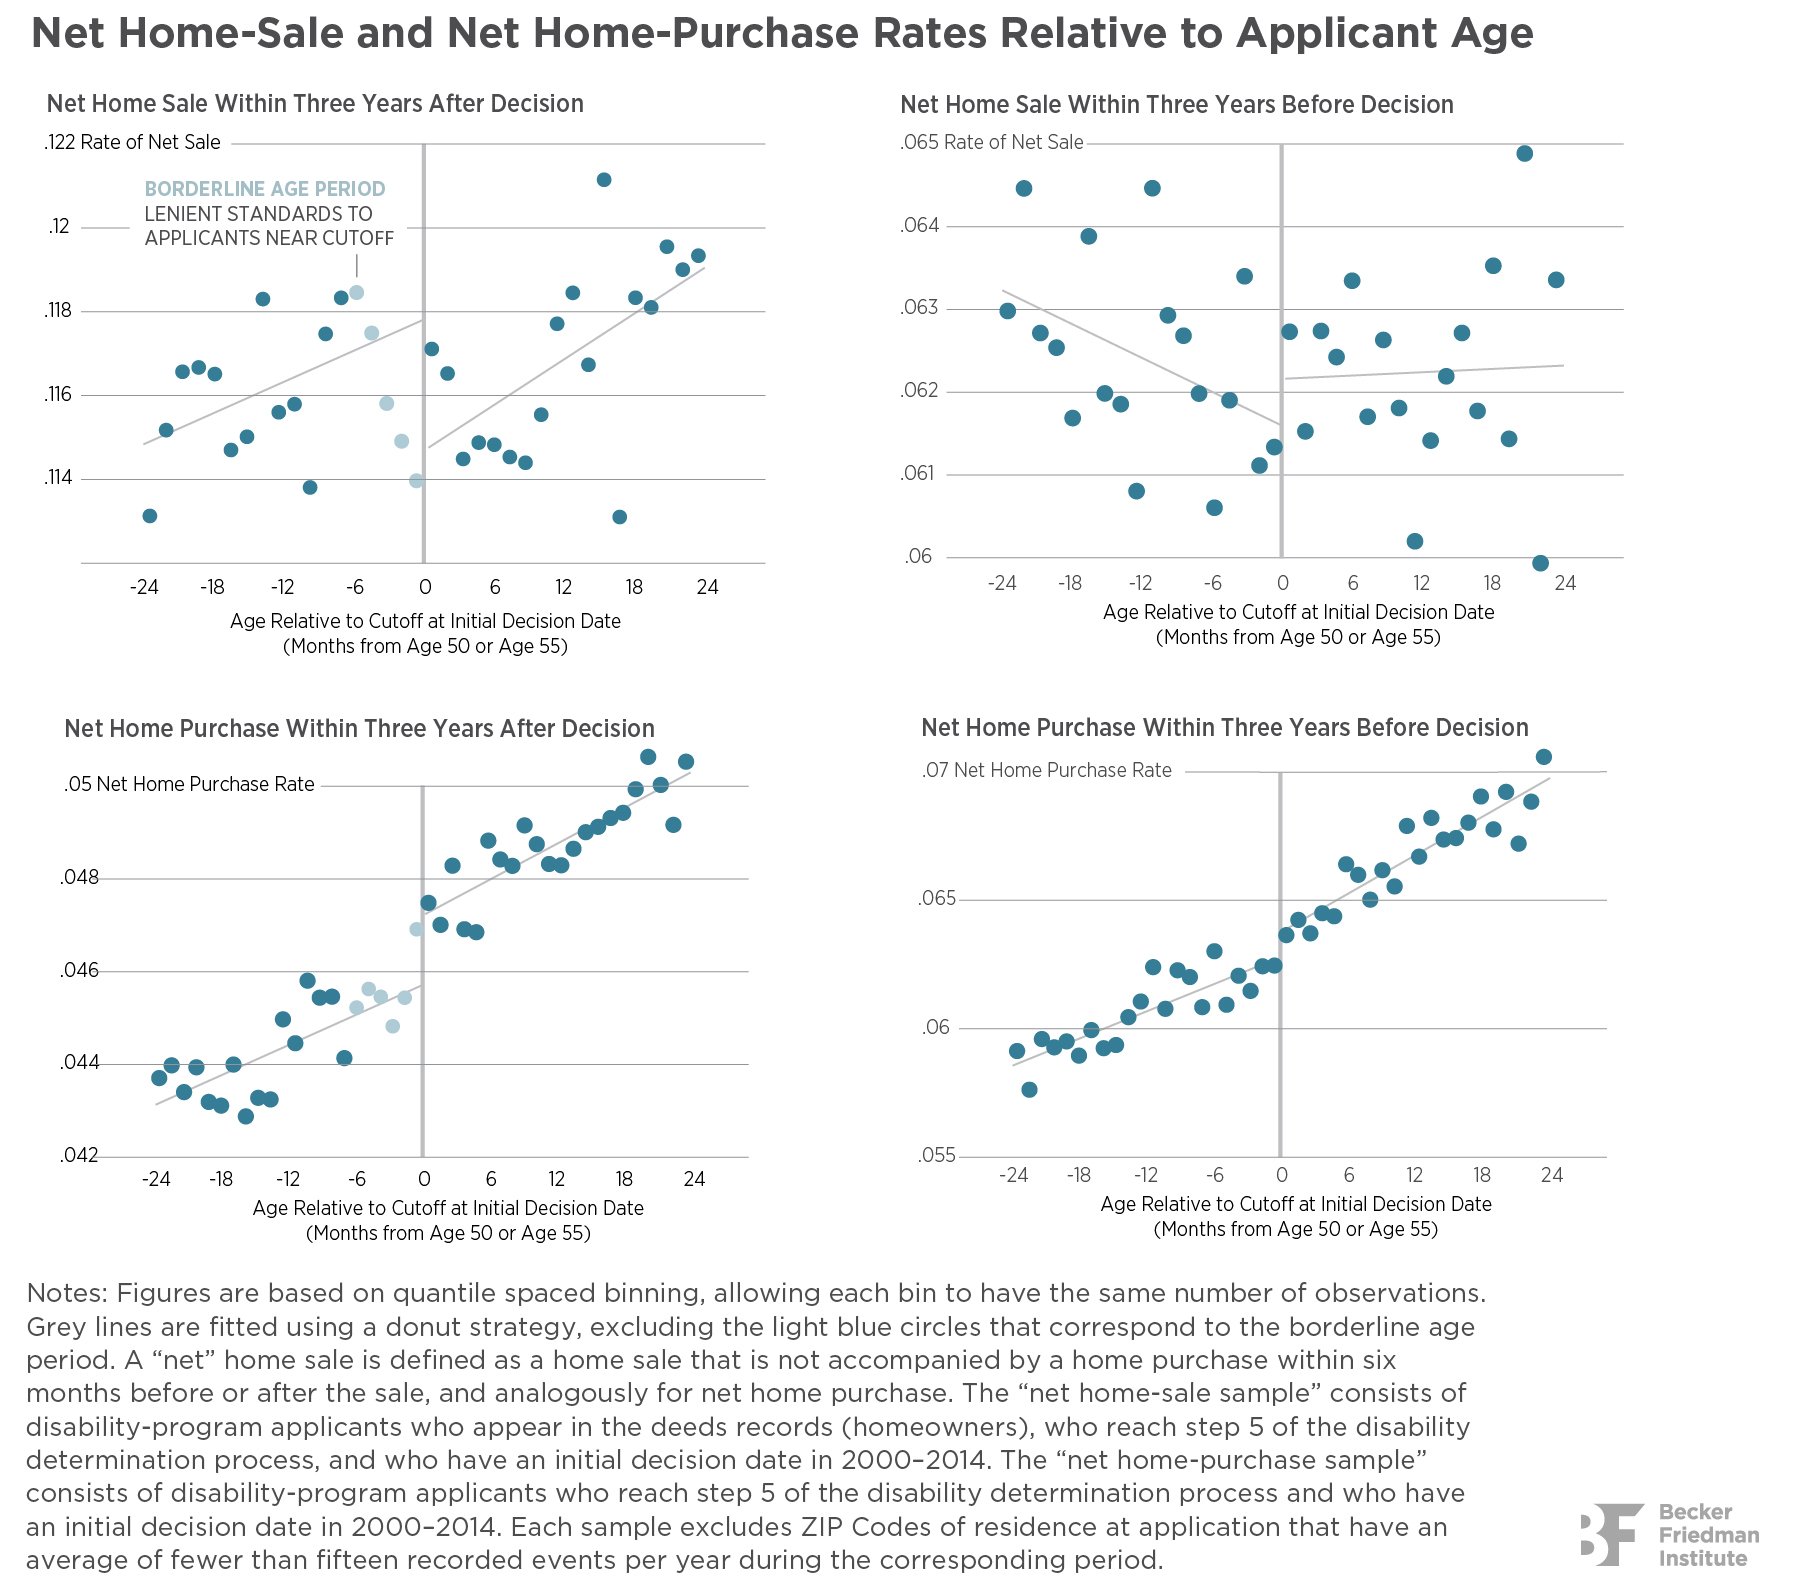
Analysis of their dataset reveals three key facts:
- Applicants for disability programs experience bankruptcy, foreclosure, and eviction at rates higher than the general population. From this fact, the authors surmise that applicants likely experience higher rates of financial distress than others.
- Adverse financial events increase in the time leading to the application date, where they peak in occurrence. This finding suggests that applicants apply for disability benefits when they are in a state of financial distress.
- Relatedly, negative financial events occur less frequently for those who apply for benefits, even if they are rejected for disability payments, suggesting that such applicants find other means to address their financial needs.
The second and third facts show the importance of application dates and what they reveal about the state of financial distress faced by applicants. What are the causal effects of disability application on the financial outcomes of recipients? According to the authors’ analysis of the data, applicants who are allowed into the program are 30 percent less likely to experience bankruptcy over the following three years, 30 percent less likely to experience home foreclosure, and 20 percent are less likely to have to sell their home. Finally, as further evidence for the positive effects of disability application, the authors reveal that allowance into disability programs results in a 20 percent increase in home purchases.
-
The Great Recession of 2007-09 raised several issues about the relationship of housing markets to economic activity. One issue concerns the impact of housing prices on the development of new and young firms. Another involves how housing market ups and downs affect local economies. Employment at young US firms (less than 60 months since first paid employee) has declined steadily since 1987, when it stood at 17.9 percent, plunging to just 9.1 percent in 2014.

While their activity is consistently marked by strong cyclical fluctuations, young firms experienced an especially sharp contraction during the Great Recession and a slow recovery afterwards. What is the role of housing market conditions—boom or bust—in shaping the fortunes of young firms? What is the role of credit markets? How are labor markets affected? This new research finds that the great housing bust after 2006 largely drove an historic collapse in the employment shares of young firms.
Housing cycles do not affect all MSAs equally, and the authors use this insight to isolate locally exogenous shifts in housing prices. They then estimate and quantify the effects of housing price swings on young firms and local economies. The authors conclude that the great housing bust after 2006 largely drove the historic collapse in the young firm share of employment during the Great Recession. The pullback in bank lending to younger firms played a secondary role.
The authors’ rich dataset spans a long time period, which is especially useful when estimating the impact of bank lending on young firms. Banks are not all the same. They serve different markets, have different lending practices when it comes to small and young businesses, and are hit differently by financial crises and national business cycles. While almost all national banks retrenched their lending practices in response to the financial crisis of 2007-09, some were in better shape than others and better able to weather the storm and participate in the nascent recovery.

MSAs served by national banks that were particularly hard hit by the crisis had bigger drops in loan volume, and this reduction in credit redounded in their lending to young businesses. Indeed, the authors find that young firms suffer more than the average small business when banks scale back lending to small firms. Similarly, the authors find that the negative effects of falling housing prices are felt more strongly by young rather than small businesses.
This research also offers insights into implications for the employees of those businesses. That young firms tend to hire younger employees is perhaps unsurprising, but the authors also find that young firms tend to hire less-educated workers, as shown in Table 1. As an example, in 2010 young firms employed 10 percent of female workers who did not finish high school but only 7 percent of female workers with a college degree. As a result, the fortunes of young firms have an outsized impact on younger and less-educated workers. Thus, the housing bust and financial crisis hurt younger and less-educated workers through their particular effects on the fortunes of young firms in addition to their broader effects on the overall level of economic activity.
-
However, new research by UChicago assistant professor of economics Yana Gallen reveals that two-thirds of the pay gap can be explained by a productivity gap between men and women that is driven by motherhood. In “Motherhood and the Gender Gap,” the first paper to link parenthood by gender to productivity measures, Gallen finds that about 8 percentage points of the 12 percent residual pay gap between men and women can be explained by lower workplace productivity of mothers.
Prior to motherhood, women are actually more productive than men and their productivity climbs again as their children age to equal that of men. However, for women who choose to have children, the fall-off in workplace production is enough to impact their pay and, possibly, the earnings of younger women whom employers assume will have children.
ChartFigure 1: Relative Wages
Gallen’s findings, based on extensive Danish private-sector data, do not mean that the factors cited above are not important when explaining wage gaps—indeed, she stresses the need for more research on all of them—but her results do suggest that productivity declines in motherhood explain a solid majority of the gender wage gap.
More productivity means more pay … if you’re a man
Gallen takes a somewhat novel approach when investigating the gender wage gap—she avoids using wages in her analysis. Instead, she estimates the relative revenue of a firm that hires a man compared to a woman with the same background. Doing so allows Gallen to take labor, material goods, and capital as inputs and treats male and female labor units as perfect substitutes (in economic parlance, she estimates a production function). The gender productivity gap is the efficiency units lost if a worker is female, holding other explanatory factors such as age, education, experience, and hours worked constant.
About 8 percentage points of the 12 percent residual pay gap between men and women can be explained by the decrease in productivity by mothers.
Gallen’s research incorporates comprehensive data from the Danish private sector (from 2000-2011) that matches worker characteristics with a firm’s accounting information to estimate the gender productivity gap. Doing so allows her to provide an updated view on gender productivity, including the discussion of motherhood, and also accounts for such factors as job sorting, or the types of jobs that women select over men. The paper also notes this slice of Denmark (the private sector) has many characteristics in common with the US labor market, especially in terms of the size of the gender pay gap. This suggests that the results may not be limited to the Danish setting.
All told, it is that deeper analysis of motherhood and productivity that is the main contribution of Gallen’s paper. She finds that the wage gap of mothers is approximately equal to the productivity gap, suggesting that there is little or no wage discrimination against mothers (in the form of uncompensated output). This finding is consistent with the hypothesis that the wage gap occurs only for women with children who work fewer and more flexible hours than their male counterparts. The general pattern that women without children are as productive as men, while mothers are substantially less productive, holds across industries and occupations.
ChartFigure 2: Relative Productivity
But this does not mean that there is no wage discrimination for all female workers. Women without children may, by extension, be penalized. The wage gap for non-mothers is smaller than that of mothers, but it is also true that non-mothers are more productive than men, meaning that non-mothers are undercompensated for their work. In addition, Gallen finds that the disparity between wages and productivity for non-mothers happens especially during their prime child-bearing ages, suggesting that firms expect women of child-bearing age to have children and, thus, they undercompensate them accordingly. After age 40, there are no meaningful differences in the relative productivity of mothers and non-mothers. Discrimination, then, is largest in the group with a smaller residual pay gap: young non-mothers.
Further, Gallen does not find a larger gap between pay and productivity for married or cohabiting women compared to single women without children. To the extent that marriage and cohabitation increase an employer’s expectations about, and an employee’s probability of, childbirth, this suggests that statistical discrimination is unlikely to be the main driver of the wedge between pay and productivity for prime-age non-mothers. Gallen takes account of the types of firms where women decide to work and finds no evidence that women work in lower wage firms within her data set.
Conclusion
Researchers have come to call the decrease in wages for mothers a “child penalty.” The contribution of Gallen’s paper is to determine how much of that penalty is explained by productivity differences in the workplace. Using Danish data she reveals how firm output varies with the gender and motherhood status of employees to find that about 8 percentage points of the 12 percent residual pay gap can be explained by productivity differences between men and women. And motherhood drives this difference.
CLOSING TAKEAWAY
The wage gap for non-mothers is smaller than that of mothers, but it is also true that non-mothers are more productive than men, meaning that non-mothers are undercompensated for their work.This productivity difference may arise from differences in the effort, extra (undocumented) hours worked, or effectiveness of men relative to women. While on average, the pay gap is quite close to the productivity gap, this is not true over all of the lifecycle. In particular, women without children are estimated to be as productive—if not more productive—than men without children, but they are still paid less than these men. Mothers, on the other hand, are substantially less productive than fathers and are paid commensurate with this productivity gap.
Finally, while Gallen does not offer policy prescriptions based on her findings, she does reinforce the need for further research on the factors driving the gap between the pay and productivity of women without children, and whether these differences reflect work preferences or occupation sorting, for example,
or discrimination. -
Since roughly 1955, women born every year in America were more likely to earn a college degree than men. At first the gap between men and women was narrow, but by 1970 it had widened considerably and has continued to expand over time. Indeed, the percent of women attaining a college degree continued to increase through the 1985 birth cohort while the percent of men holding a degree has actually declined since 1970. (See Figure 1.) What this means is that of all the women born in America in 1985, roughly 40 percent hold college degrees today, while just under 30 percent of men born in 1985 have a college degree.

Learning this, one might naively assume that the pay gap between men and women has closed and that, perhaps, women might be earning even more than men given their relative educational success. Of course, that is not the case, and Figure 2 shows that while the pay gap has narrowed since 1950, the downward trend in that gap has largely stalled since 1970. Women born in 1985 can still expect to earn upwards of 10 percent less than their male counterparts, regardless of how much schooling they have attained.
These facts, in particular the underrepresentation of women in the upper part of the earnings distribution, describe what is known as the glass ceiling, and Bertrand reviews the extensive literature surrounding the glass ceiling, stressing that an examination of the phenomenon must extend beyond discrimination and sexism to include other quantitative factors such as education, psychological attributes, work flexibility, childcare, and nonmarket work. She also reviews policies meant to help crack the glass ceiling and to get those lines in Figure 2 to start moving toward zero.

What are the policy options that might crack, if not break, the glass ceiling?
Family-friendly policies. Such work-place policies that include, among others, longer and paid maternity leaves, optional part-time or shorter work hours, and the opportunity to work remotely, address the demand for greater flexibility, but they don’t help address earnings gaps as long as they are negatively priced and as long as they are used mainly by women.
Gender-neutralizing childcare. Sweden, Norway, and Quebec have introduced dedicated paternity leave into their parental leave policies, meaning that the time is lost if not taken by the father. Known as “daddy quotas” or “daddy months,” these policies address a core problem for women who otherwise take a long absence from work and whose career and pay suffer.
Quotas. Following the lead of establishing quotas in political representation, some European countries have introduced quotas into corporate leadership policies. Norway, for example, in 2003 mandated 40 percent representation by women on the boards of public limited liability companies. Seven Eurozone countries followed suit, and in 2013 the European parliament approved a draft law that would require 40 percent female board members in about 5,000 listed companies in the European Union by 2020.
-


In December 2017 the unemployment rate was 4.1 percent, far below its peak of 10 percent in October 2009 in the depths of the Great Recession, and nearly equaling the 3.9 percent in December 2000. From this reading of the data, the labor market had made tremendous gains to return to its pre-crisis strength. However, those headline unemployment numbers mask a precipitous decline in employment among prime-age working men linked to the decline in manufacturing, with negative effects that extend beyond the health of labor markets to the well-being of communities and their citizens.
Between 2000 and 2017, employment rates for men aged 21 to 55 fell by 4.6 percentage points, and hours worked per year fell by over 180 hours (employment effects for women are also negative but less dramatic). These declines in employment began prior to the Great Recession while the economy was growing, and only worsened after 2007.
To put this decrease in perspective, the secular (or long-term) decline in annual hours worked for prime-age men from 2000 to 2017 is as large as the cyclical decline in annual hours worked during the 1982 recession. In other words, while the economy cycled through ups and downs between 2000 and 2017, prime-age working men endured a sort of shadow downturn, a 17-year decline in employment.
Using a variety of data sources and empirical approaches, the authors reveal the connection between this decrease in hours worked and the decline in manufacturing. Perhaps most sobering is the authors’ conclusion that those manufacturing jobs are not coming back. The increased pace of decline in manufacturing employment since 2000—when output actually increased by about 5 percent—reveals that improvements in productivity are driving the decline in employment. Fewer workers are needed to produce more, and this won’t change. Therefore, efforts to rescue jobs through trade policy are misdirected, the authors’ show.
Beyond the labor market, the authors find further negative effects stemming from the decline in manufacturing employment. The authors’ novel research supports the emerging view that labor market conditions can impact different dimensions of health: In this case, loss of manufacturing jobs are associated with higher rates of prescription opioid abuse and overdose deaths. Further, those negative social effects can prevent the economic recovery of these regions as possible employers may be reluctant to locate where a large number of potential workers frequently fail drug tests.
Finally, the authors investigate why these sectoral changes seem so intractable. Industries have evolved for decades and workers have either moved, taken new jobs or otherwise adapted. However, many workers today in these communities seem trapped in place, opting to drop out of the workforce and otherwise make ends meet.


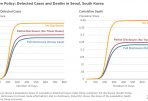


Over the last century, species extinction around the world has occurred at rates about one hundred times higher than previous mass extinctions, leading scientists to label the current human-driven phenomenon as the sixth mass extinction in the planet’s history. While biodiversity loss is arguably costly, and efforts are made to restore and protect endangered species, we know precious little about the effects of lost species on human well-being. Likewise, policymakers often fly blind when considering mitigation efforts, especially when such extinction events occur unpredictably.
Economic theory has long recognized the conceptual and practical difficulties involved in carrying out a forward-looking cost-benefit analysis in the presence of uncertainty, irreversibility, and catastrophic tail risks, and those factors figure prominently when considering the cost of species extinction. Studying marginal changes, for example, does not capture the effects of catastrophic collapse; also, data limitations of, say, species populations, often constrain causal evidence; and the number of potentially endangered species is large, forcing researchers to target both evaluation and conservation efforts.
For this paper, the question at hand is the effect of a rapid decline in the population of vultures in India caused by the introduction of a veterinary medicine, diclofenac, that was passed to vultures via carrion, with deadly consequences. Please see the working paper for more details, but the authors combine techniques from economics and ecology to address the research challenges described above, including a difference-in-differences strategy to compare districts with habitats highly suitable for vultures to those that are unsuitable, both before and after the onset of diclofenac use.
Before describing the authors’ findings, a brief note about vultures’ crucial role in India’s biosphere. Vultures have long provided critical environmental sanitation services by quickly dispatching of carcasses in India, which was home to over 500 million livestock animals in 2019, the most in the world. However, beginning in the second half of the 1990s, and over the course of just a few years, the number of Indian vultures in the wild fell by over 95% following the introduction of diclofenac. Once numbering in the tens of millions, this decline is the fastest of a bird species in recorded history, and the largest in magnitude since the extinction of the passenger pigeon in the United States. As vultures died out, the scavenging services they provided disappeared too, and carrion were left in the open for long periods, likely leading to an increase in the population of rats and feral dogs, in the incidence of rabies, and in the transmission of pathogens and diseases such as anthrax to other scavengers, as well as to increased water pollution from carcass dumping and surface runoff.
What are the human health-related effects of this rapid, unexpected decline in a keystone species (considered to be those that help hold the ecosystem together)? The authors find the following:
As the authors describe, vultures are not the most beloved of creatures and, consequently, likely do not attract attention when it comes to species decline. Yet, as this research reveals, vultures perform a valuable service that profoundly impacts human health (and also provides other economic and cultural benefits described in the paper).
Bottom line: the restoration of vultures could lead to large increases in human welfare in India and suggest a critical need to protect vultures in other settings, such as parts of Africa, where the birds still exist and feed partly on livestock carrion. Further, this research argues for thoroughly evaluating the role of all keystone species and their impact on human well-being and, in doing so, prospectively evaluating policies with potential negative species effects.